🗃️ Data Source#
The Data Source section allows you to manage the information used by the dashboard.
From here, you can:
Select an experiment available in the system.
Explore all data related to that experiment, including metrics, time series, model results, and any other relevant information.
This section centralizes access to the data, making it easier to review and ensuring that the dashboard always displays the correct and most up-to-date information.
The sections below describe the different functionalities provided by STAMM dashboard.
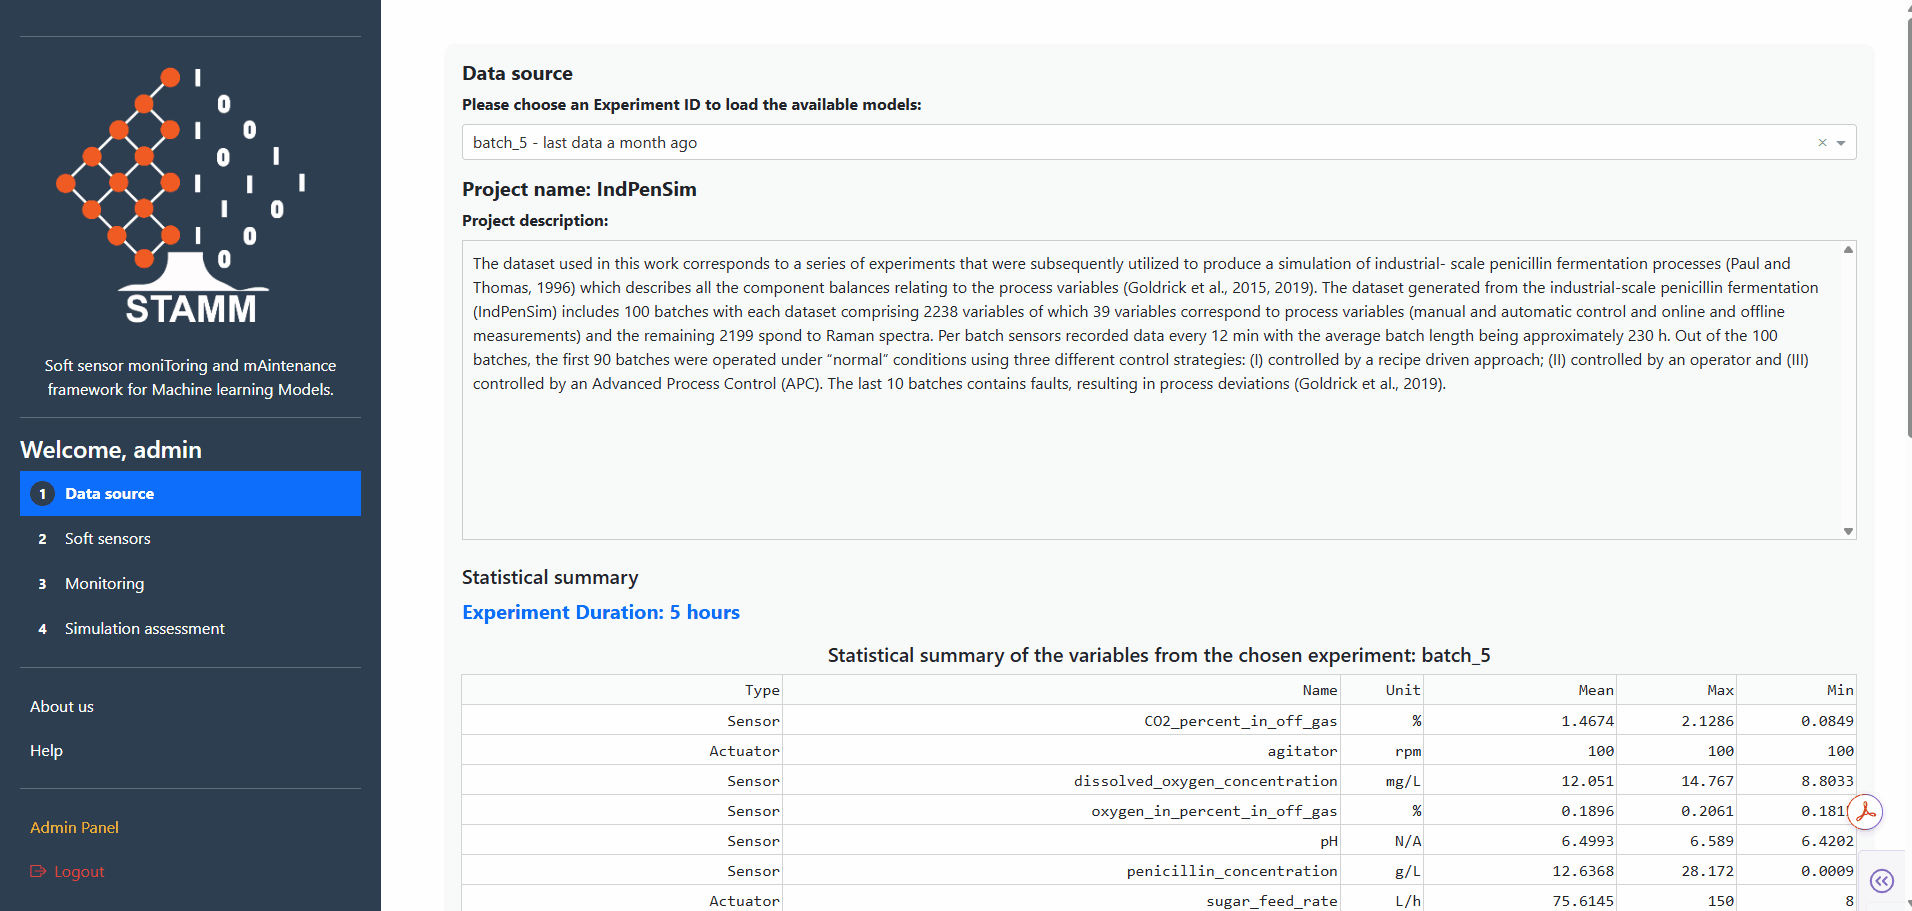
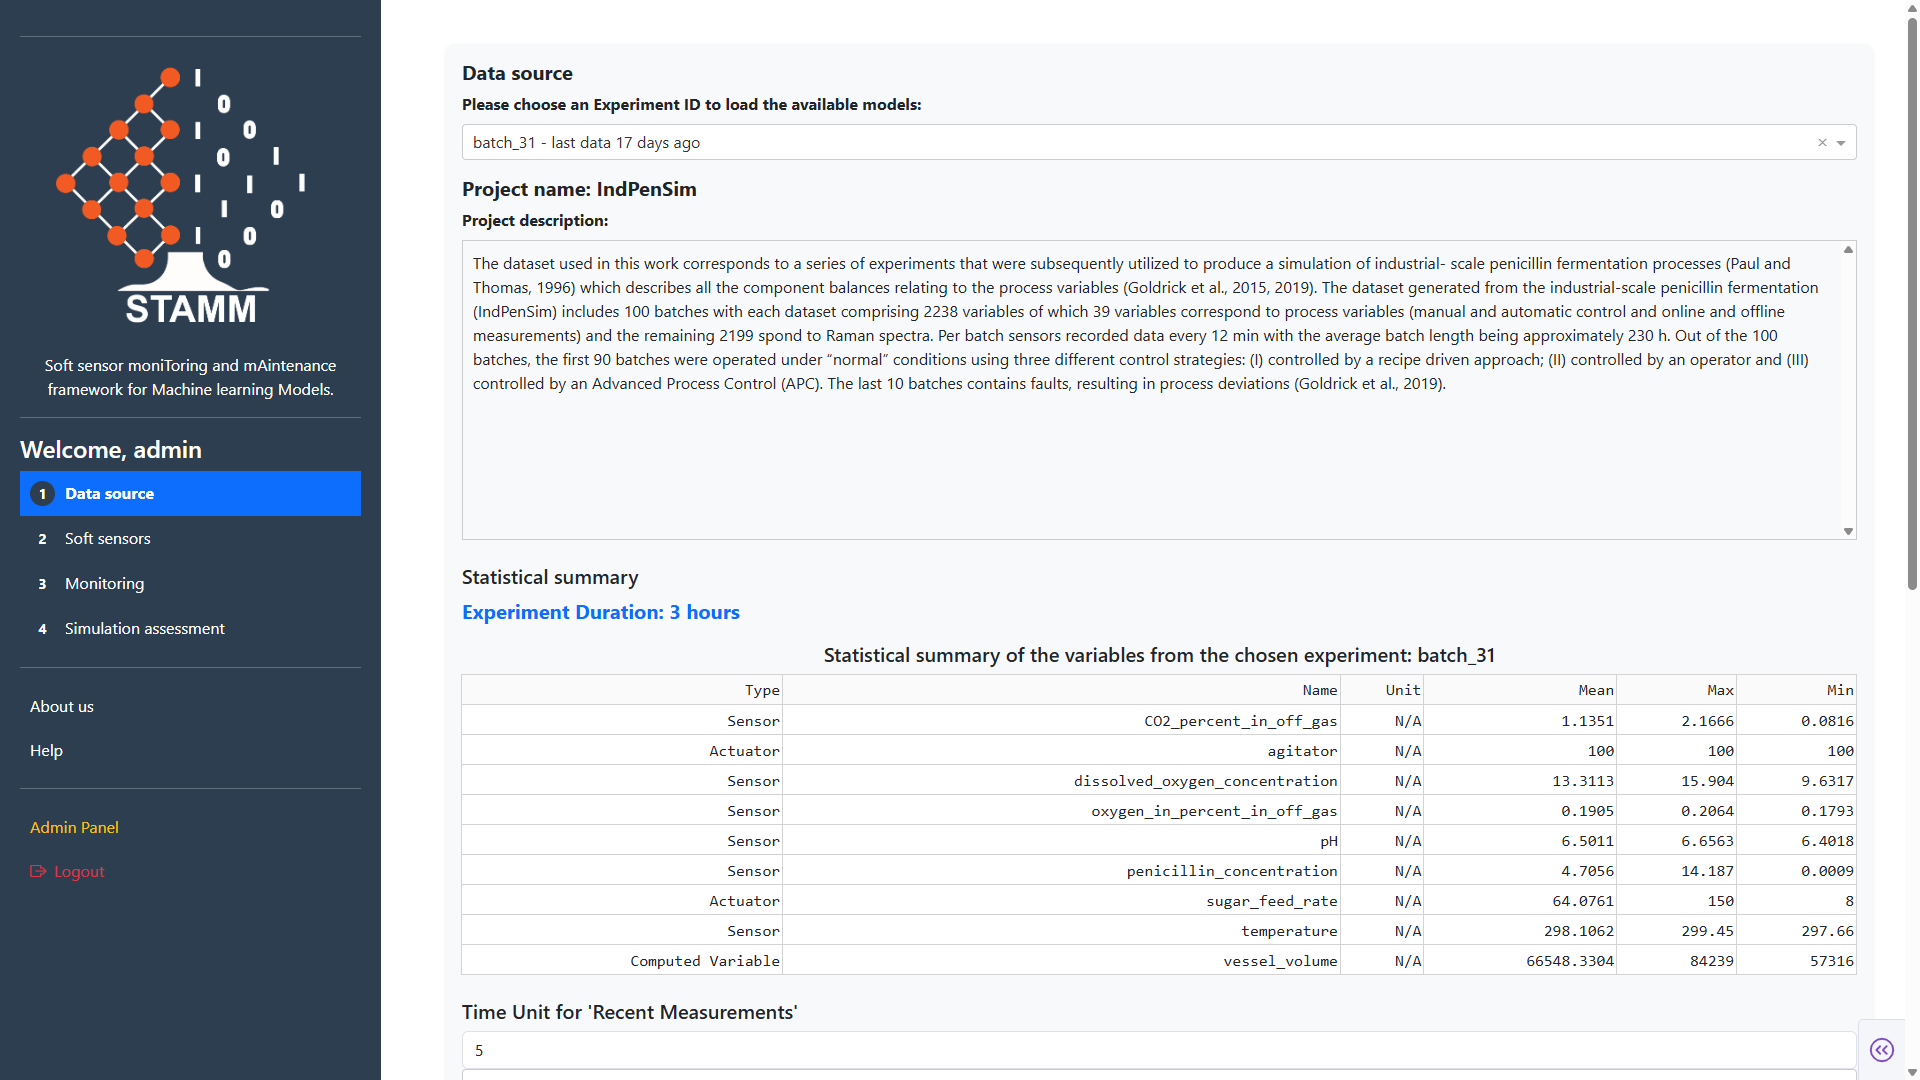
The Experiment Selector lets you choose the experiment from which data will be retrieved.
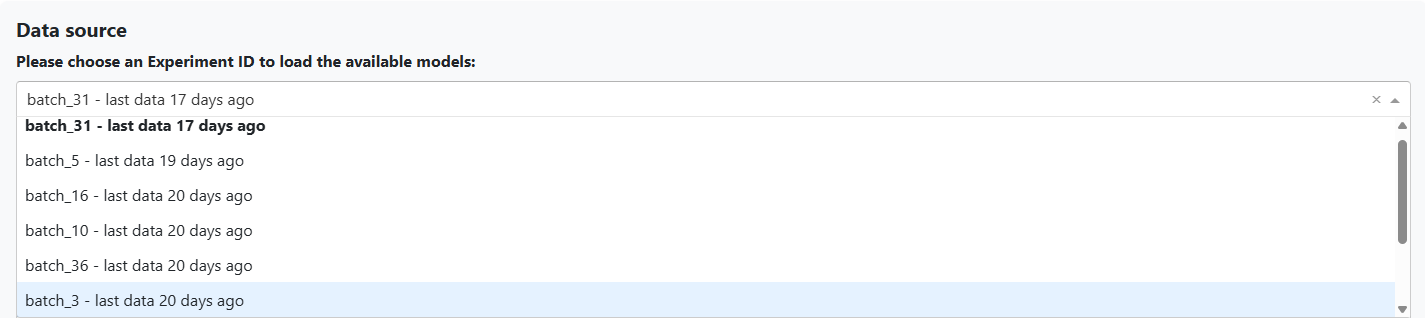
This component allows you to specify the experiment you want to analyze. Once an experiment is selected, the dashboard automatically loads its data and displays the predictions generated by the available soft sensor models.
The Experiment Selector dropdown also provides additional context by showing how long it has been since the last data point was received for each experiment, helping you quickly assess its recency and relevance before proceeding with the analysis.
The Statistical Summary section provides a clear, visual overview of the detailed data associated with the selected experiment, allowing you to quickly assess key metrics and trends.
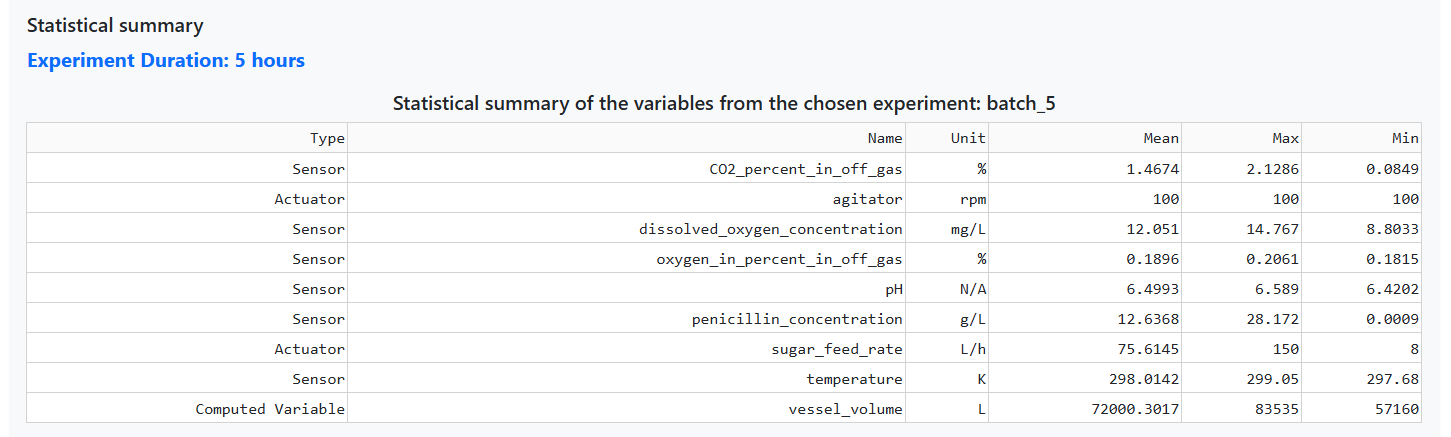
When an experiment is selected, this panel displays a comprehensive summary of all the variables included in that experiment, as well as the total duration of the experiment.
Each variable includes information such as:
Type: Soft Sensor, Actuator, Sensor, or Computed Variable.
Name: The variable name as stored in the database.
Unit: The measurement units used during the experiment.
Mean: The average value calculated across all samples.
Max: The highest recorded value.
Min: The lowest recorded value.
This summary provides a clear understanding of the distribution and characteristics of the dataset.
The Last Measurement section displays the most recent data collected from experiments that are currently in progress, allowing you to monitor ongoing measurements in real time.
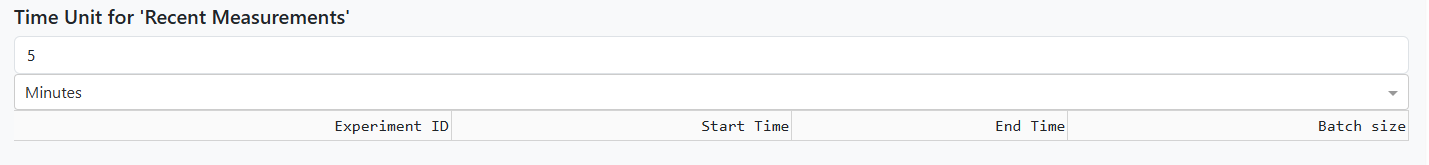
To use this feature, you need to specify a numeric time value and select a corresponding time unit (Minutes, Seconds, Hours, Days, or Months). The dashboard will use this configuration to retrieve the most recent data within the defined time range.
Once the query is executed, the dashboard will display a table containing key information, including::
Experiment ID for each experiment found within the selected time range
Start time of each experiment
End time Timestamp of the most recent value received for that experiment
Experiment size, calculated as the total number of samples stored in the database at the time of the query
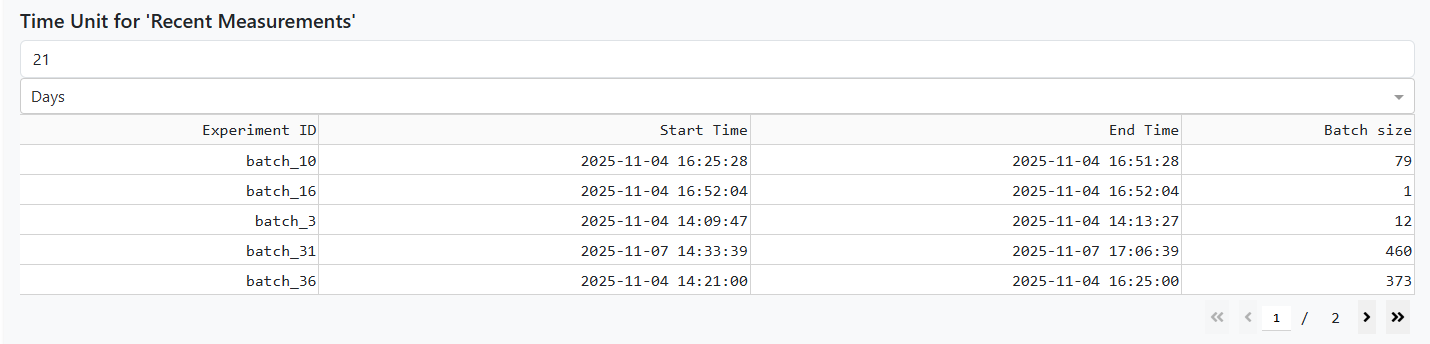
This allows you to quickly review and compare experiments based on the most recent available data.
The Valid Data Points Over Time section allows you to analyze how many valid data points were collected within a selected time range, offering insights into overall data availability and quality.
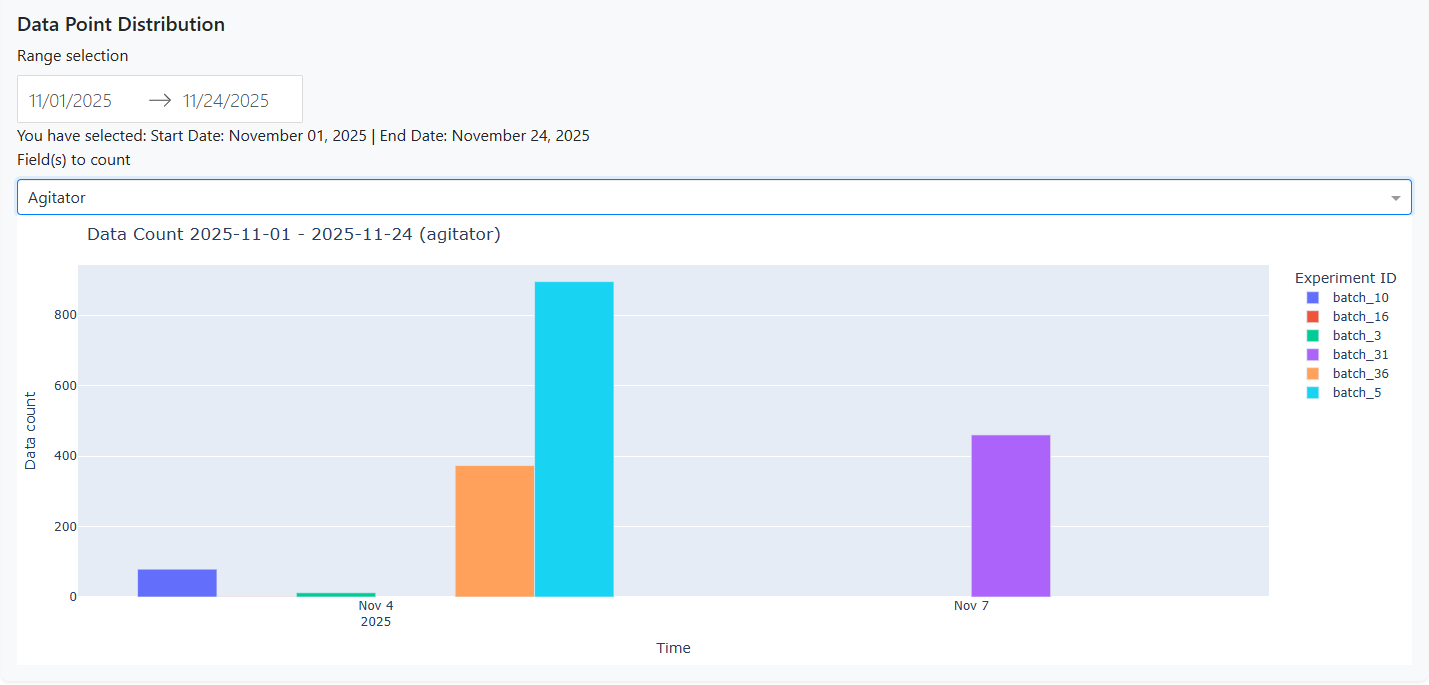
You can perform the following actions:
Select a custom date range
Choose specific variables, or select all variables associated with the experiment
After applying your selections, the dashboard displays the total number of valid data points within the chosen interval, helping you evaluate data completeness and consistency over time.
🎬 Video: Exploring Experiments and Data Connections
In the following video, you can see the complete workflow for selecting an experiment from the database and exploring the different tools and features available in the Data Source section.