✍️ Simulation Assessment#
The Simulation Assessment section allows you to select the soft-sensor model you want to evaluate and define the time range using a slider, based on the data from the experiment ID selected in the Data Source section. This functionality enables you to inspect model predictions through an interactive visualization and track the behavior of one or more model variables alongside the predicted outputs.
Additionally, the section provides tools to search for specific values within the monitored variables. This feature makes it easy to identify anomalies, document these unusual values, and generate reports summarizing the anomalous behavior of the monitored model.
The Simulation Assessment section provides a comprehensive interface for evaluating soft sensor performance under various scenarios.
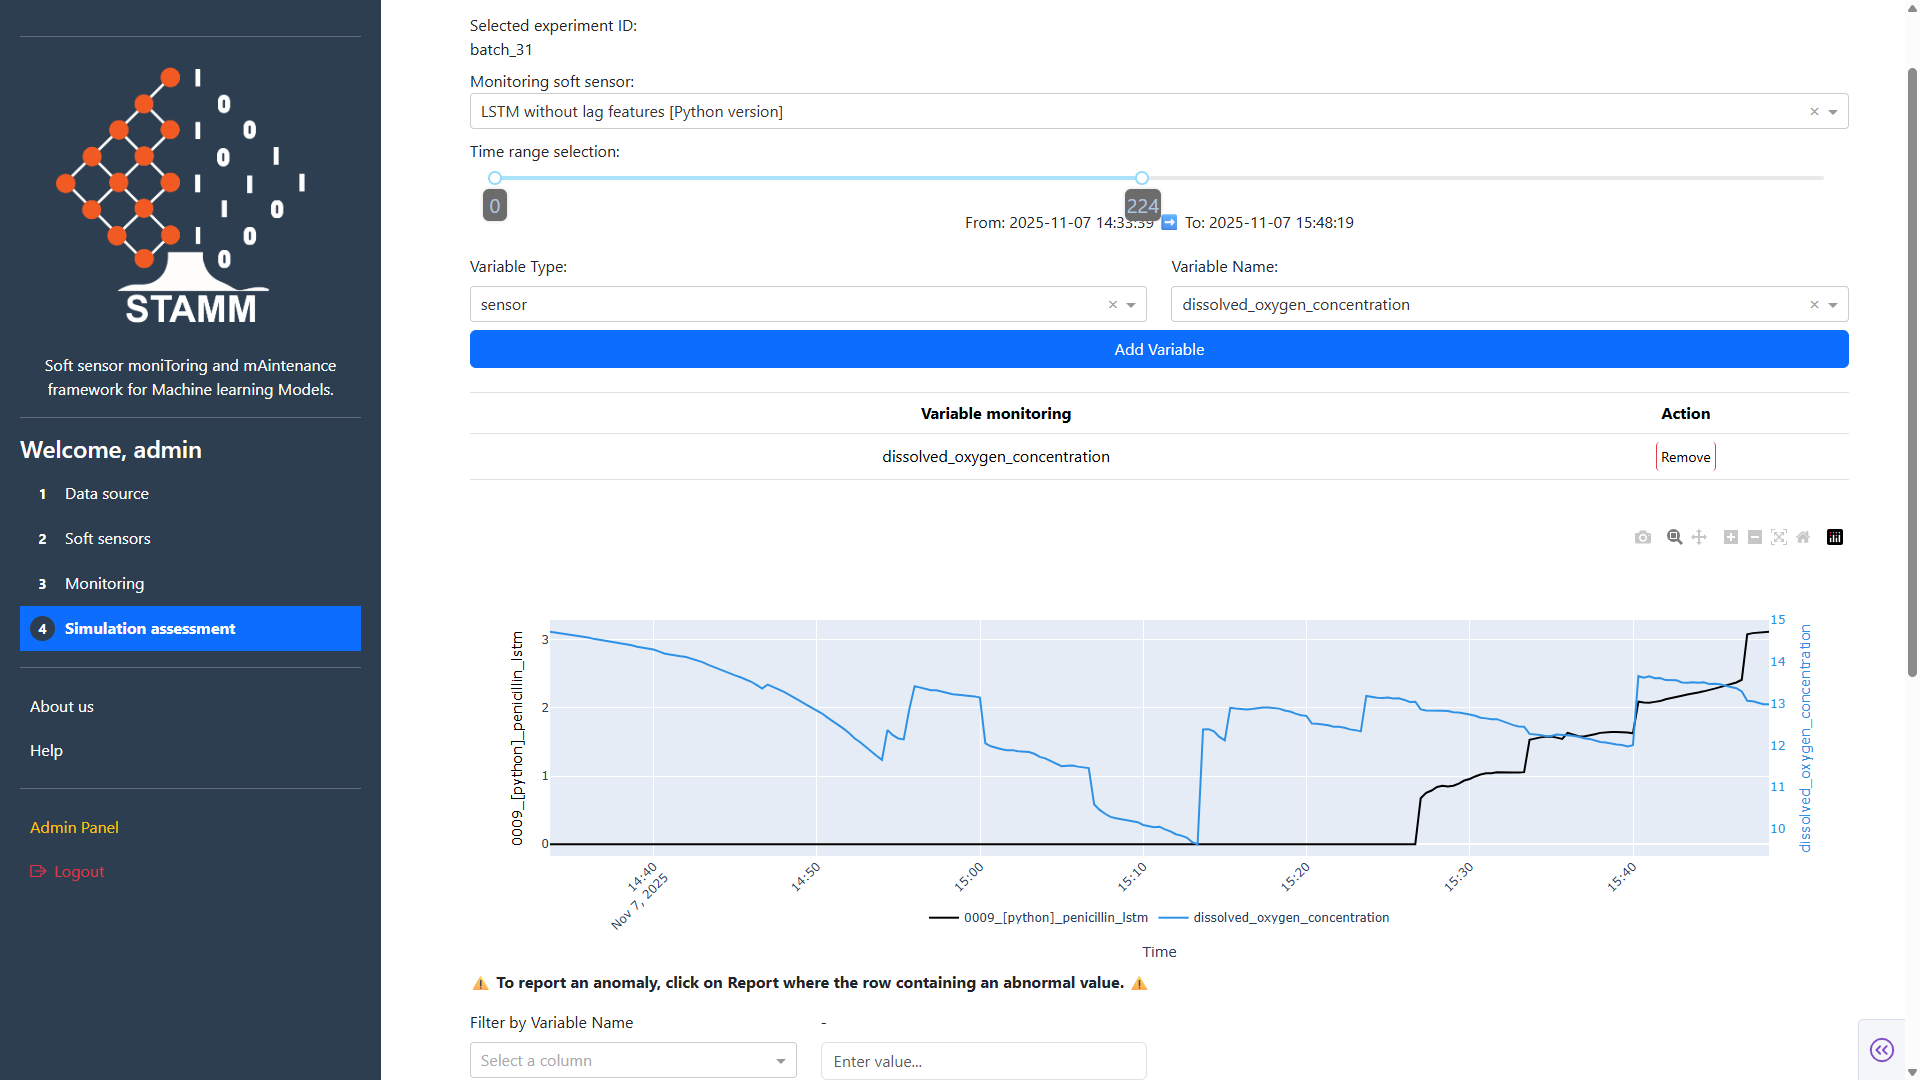
Initial panel: Upon launching the STAMM dashboard, you are presented with a form that allows you to:
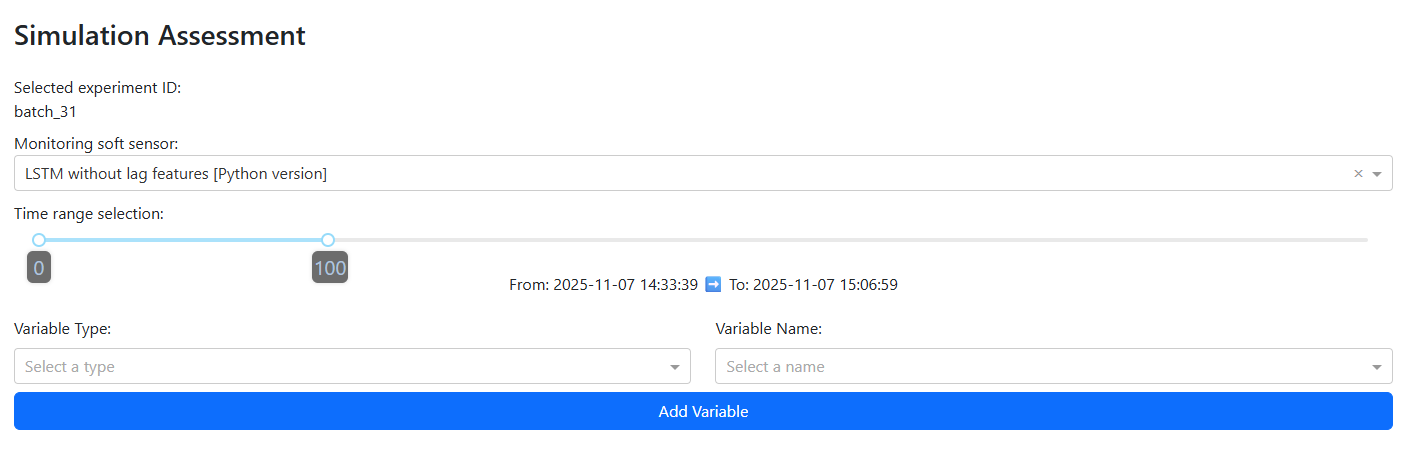
Select a monitoring soft sensor from a dropdown menu listing all models available in the Model Repository.
Specify a time window to define the range of data points considered for the experiment currently selected in the Data Source section.
Add variables to monitor, enabling you to track additional inputs that the selected model considers, alongside its predictions.
This section is designed to give users flexibility in configuring simulations, ensuring that the evaluation reflects the conditions and variables most relevant to your analysis.
Once the information from the previous panel has been entered, a chart will be displayed that allows you to compare the behavior of selected variables against the model’s predictions over the chosen time window.
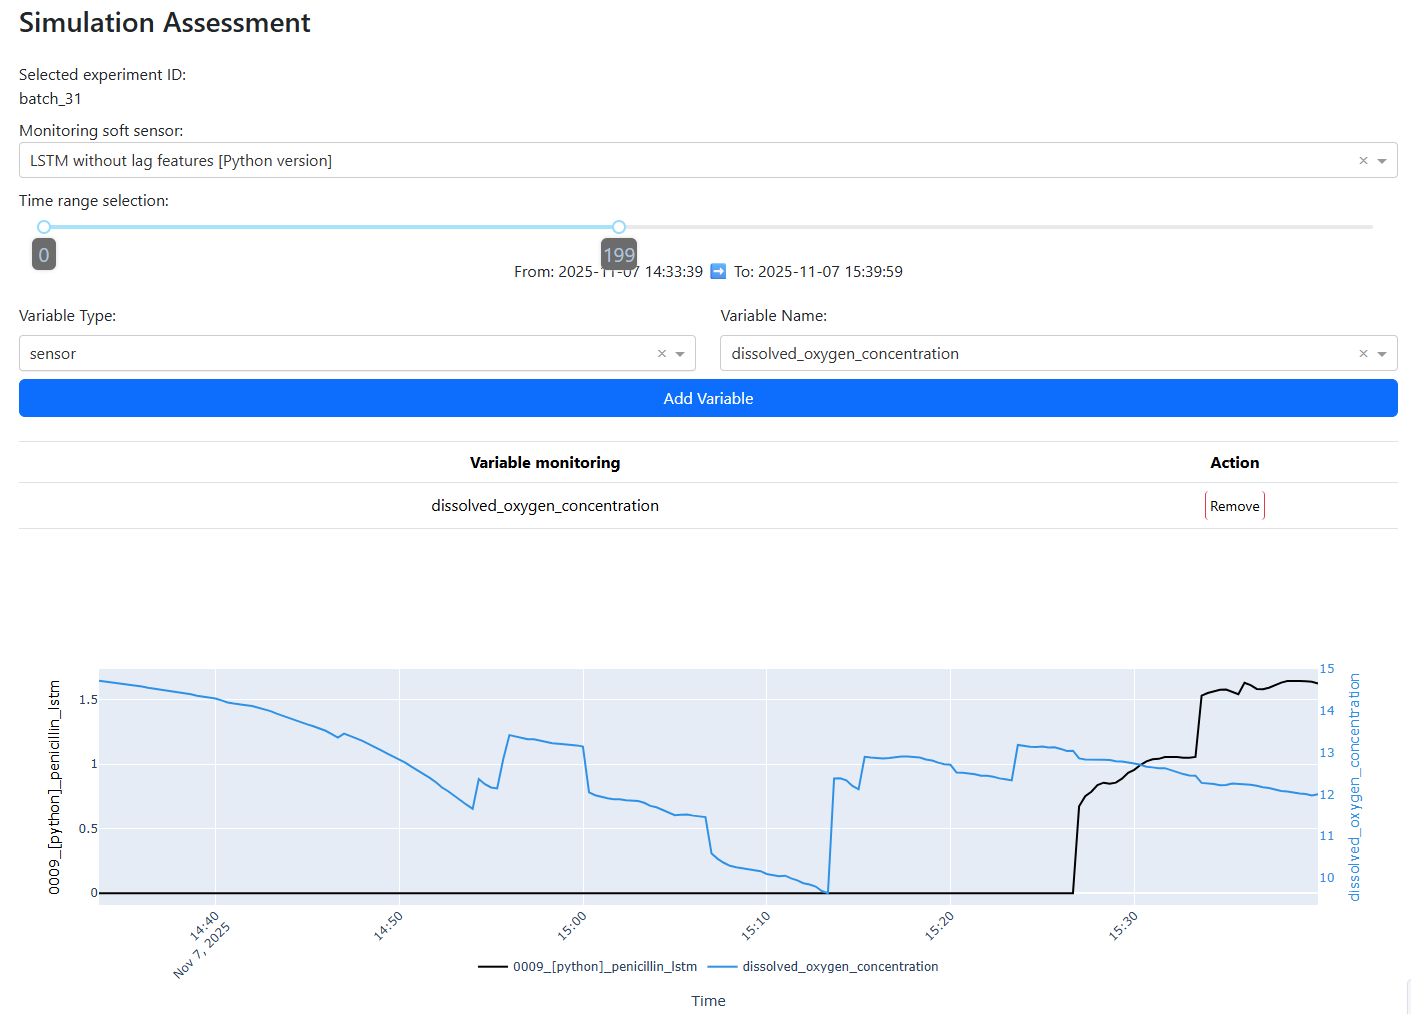
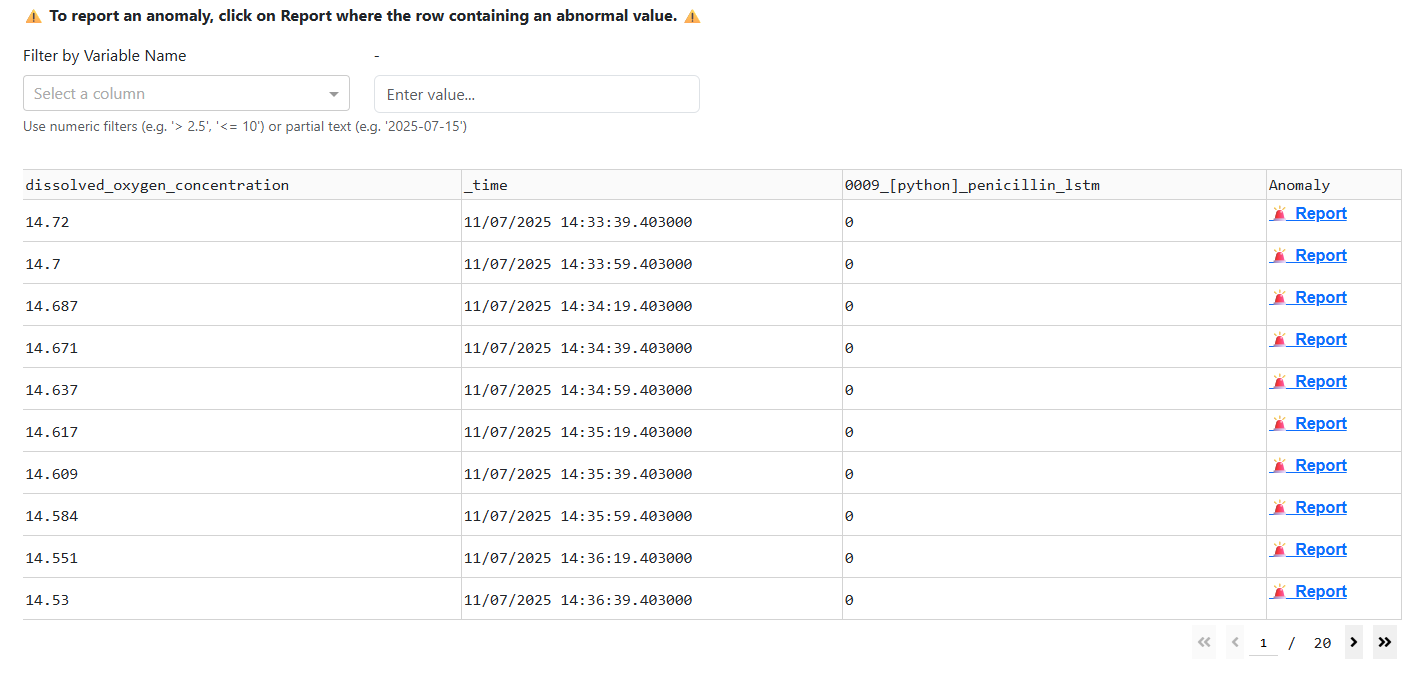
Upon entering the information in the initial panel, a table is displayed showing the data used in the chart. This includes the values of the model’s monitored variables, the model’s prediction values, and their corresponding timestamps.
The table offers two key functionalities:
Value Filtering: Allows you to filter the data based on specific criteria to focus on relevant subsets.
Anomaly Reporting: Enables you to identify and report anomalies in the data, supporting deeper analysis and quality assurance.
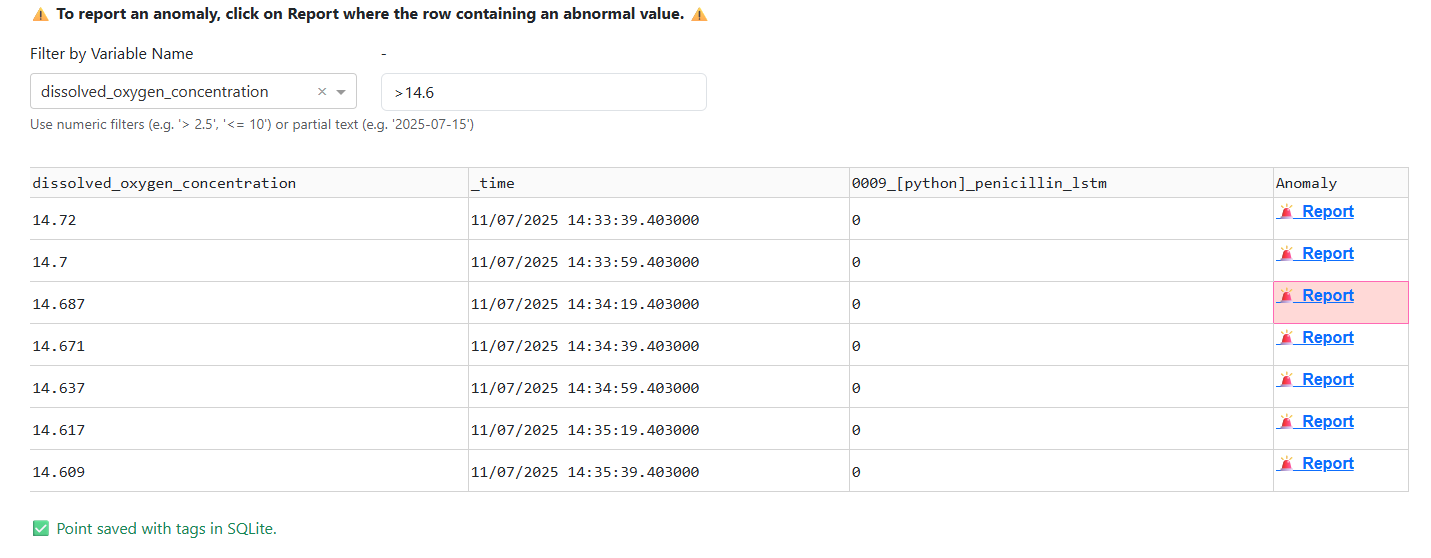
Value Filtering: This feature helps you locate specific values within the dataset used by the chart. You can search by variable, timestamp, or model value, making it easier to focus on relevant data points.

The filter supports a variety of operators such as >, <, >=, <=, as well as partial text searches, including dates. This functionality allows for precise and flexible data exploration, enabling you to quickly identify patterns or anomalies within the dataset.
Anomaly Reporting: The table includes a button that allows you to report anomalies detected in either the model’s prediction values or the monitored variables. When you click this button, a popup form appears. Similar to the example shown below:
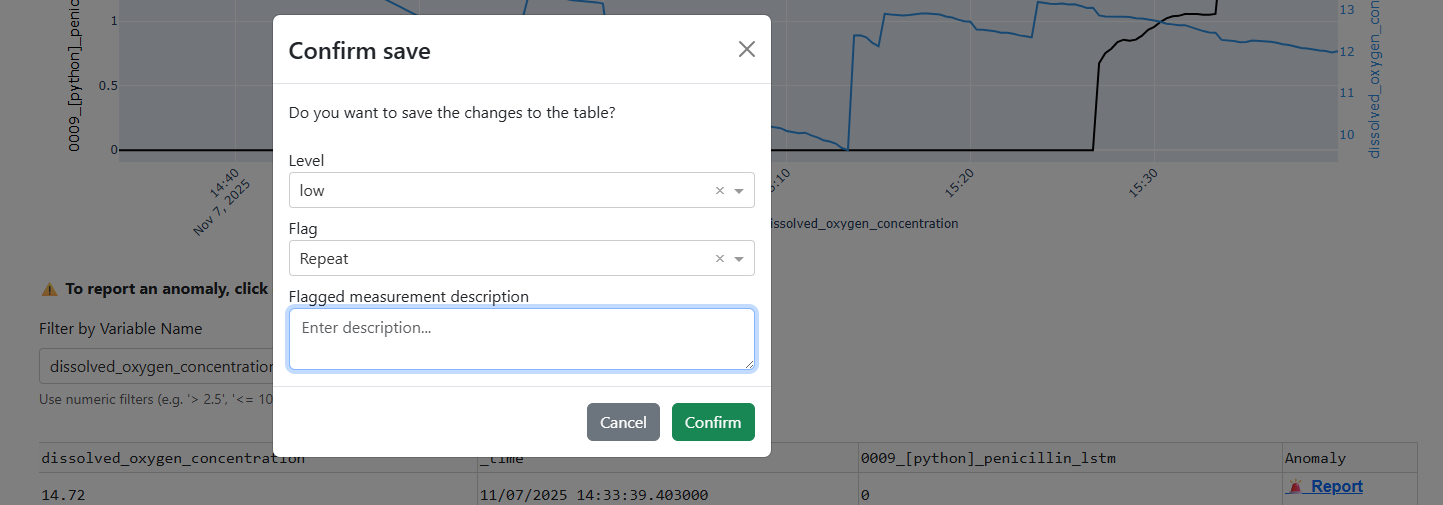
Prompting you to enter the following information:
Level: Defines the severity of the anomaly (Low, Medium, or High).
Flag Type: Specifies the category of the issue, such as Repeated Value, Zero, NaN, or any other applicable condition.
Additional Details: A text field where you can provide further context or describe the anomaly in more detail.
After submitting the form, a green confirmation message appears at the bottom of the table indicating that the anomaly has been successfully saved.
All reported anomalies are then included in the comprehensive report generated when you click Generate Report.
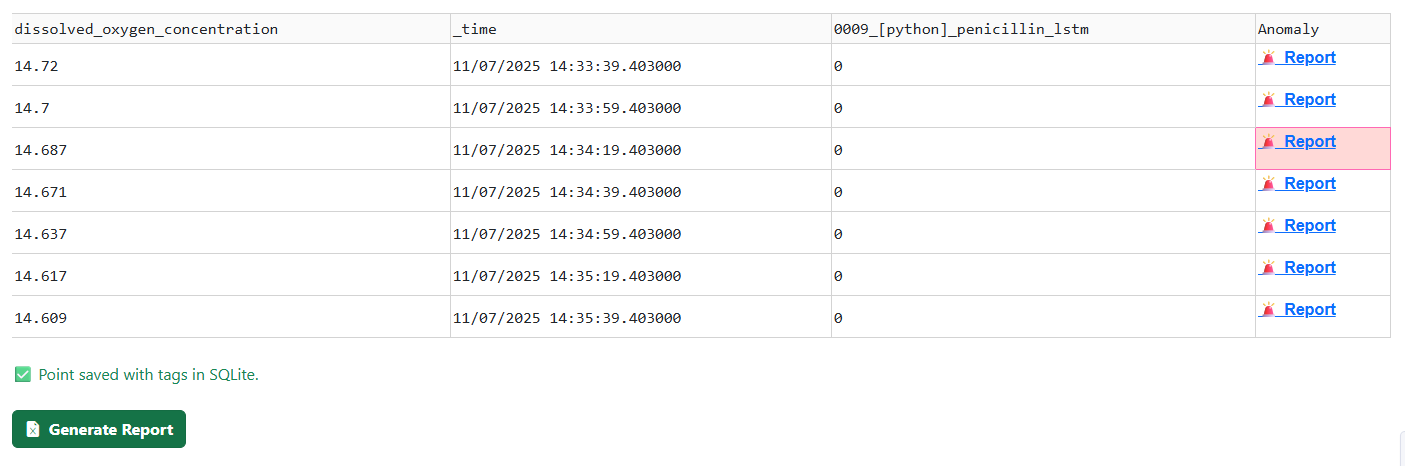
This action produces an .xlsx file containing the full set of recorded issues, enabling thorough documentation, review, and traceability of data anomalies.
The downloaded Excel file consists of the following three sheets:
Metadata: This sheet contains detailed information about the experiment and monitoring configuration, including:
Experiment ID
User who performed the action
Selected Model
Time Range selected for analysis (start and end)
Variables chosen for monitoring
Model Metadata, including a URL link to the model’s description
Database Information, specifying the Bucket and Database used
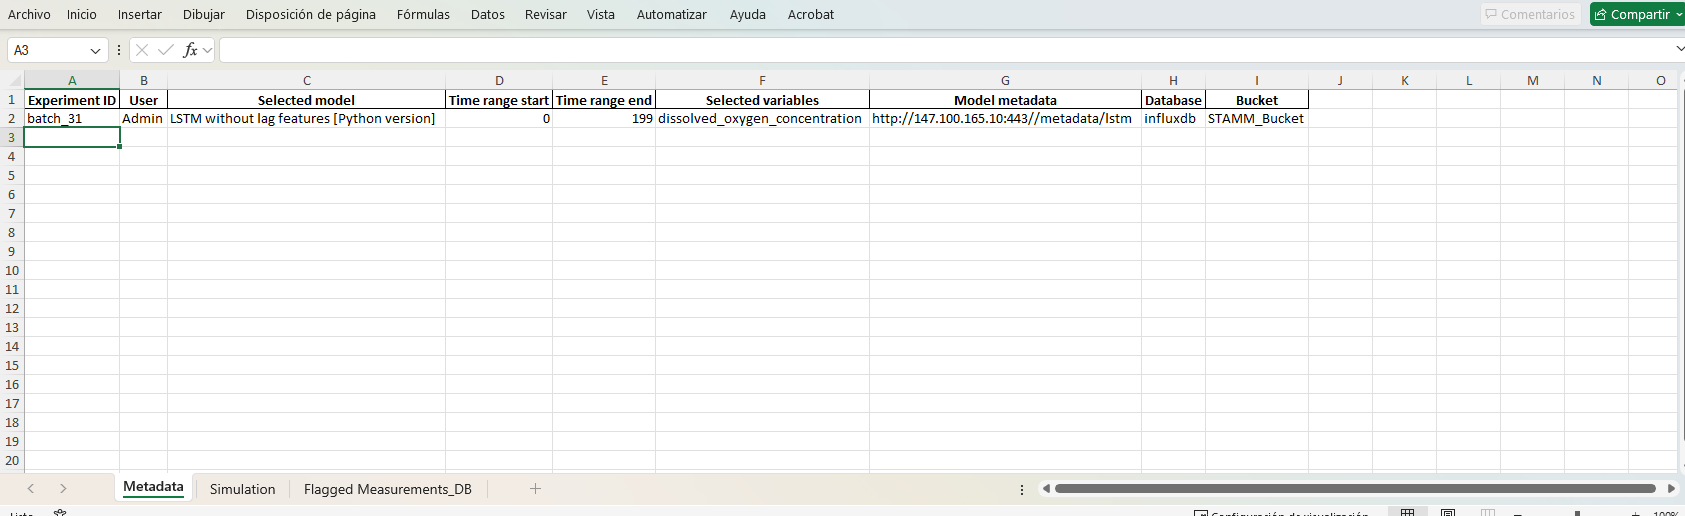
This sheet provides a comprehensive overview of the experiment setup, ensuring traceability and context for all subsequent analysis.
Simulation: This sheet contains detailed information for each data point, including:
Timestamp of the measurement
Simulation Prediction generated by the model
Variable Values monitored during the simulation
Anomaly Report for each data point, including the fields Type, Level, and Description
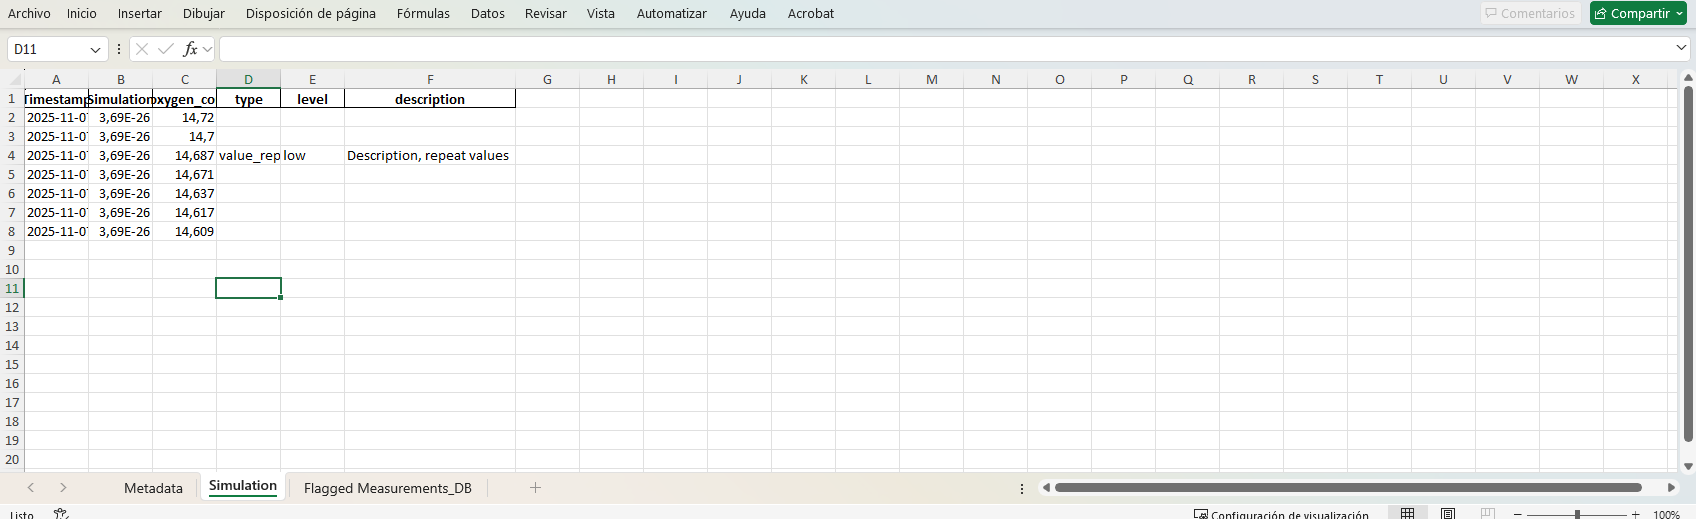
This sheet provides a complete record of the simulation outputs and any associated anomaly annotations.
Flagged Measurements_DB: This sheet contains all reports submitted for monitored values. It details how each report is stored in the database, including:
Timestamp: The time of the reported value
Measurement: The name of the measured variable
Measurement Value: The value of the variable at the reported timestamp
Tag 1: The type of anomaly or report
Tag 2: The severity level of the report
Field 1: The selected model associated with the report
Field Value: The predicted value from the model
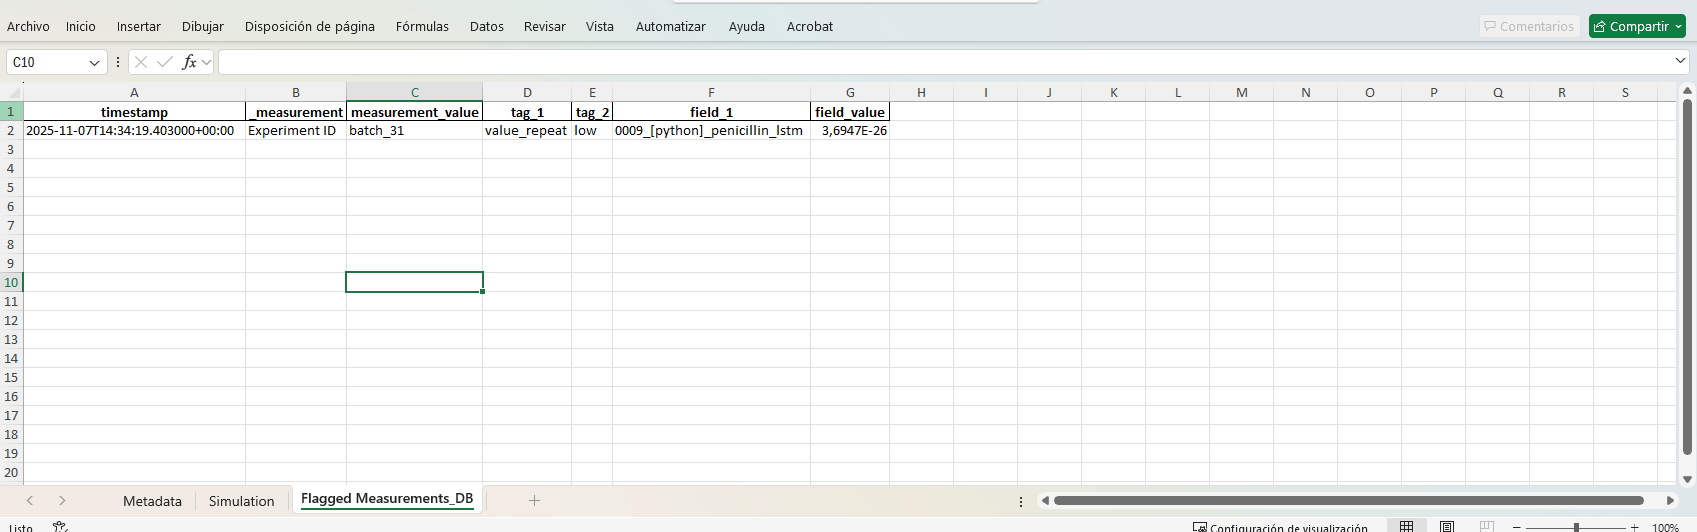
This sheet provides a complete, structured view of all flagged measurements,
🎬 Video: Post-Experiment Analysis and Labeling
See how to label and analyze data after an experiment concludes, identify anomalies such as sensor faults or simulation errors, and assess soft sensor performance in offline mode.
Explore how to select a soft-sensor model, define a custom time window, and interactively visualize predictions alongside key model variables. Learn how to use the value search and anomaly detection tools to spot unusual behavior, document abnormalities, and generate summary reports based on monitored data.