🤖 Soft Sensors#
The Soft Sensors section provides a centralized workspace for exploring and monitoring model-based predictions. From this panel, you can:
Select a prediction model from the available options and review its detailed configuration.
Visualize real-time or historical predictions generated for the experiment currently chosen in the Data Source section. Add additional variables associated with the selected model to monitor them alongside the model’s predicted outputs.
This section is designed to give you a clear, interactive view of how each model behaves, helping you validate results, compare performance, and track key indicators during your analysis.
The following guide explains how to use the Soft Sensors section and details the available controls. This overview will help you understand how to navigate the interface, and monitor key variables effectively.
Select a prediction model: When you first open the Soft Sensors section, the Model Name dropdown is empty, as shown in the image below.
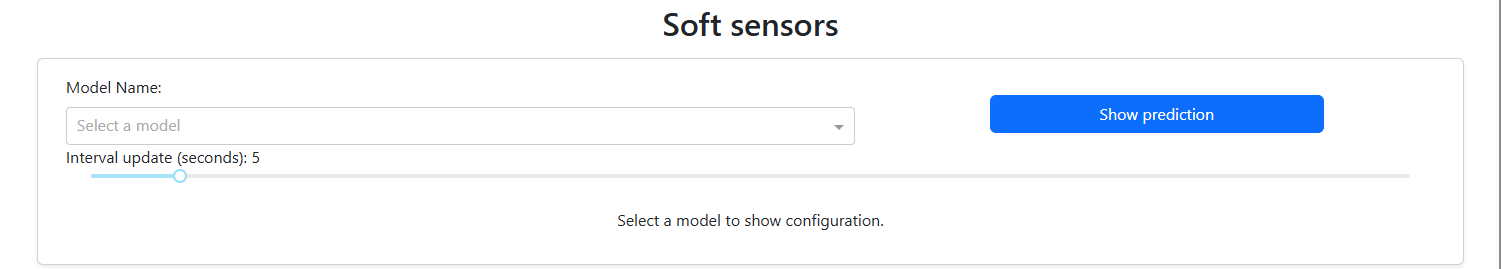
You will also see the Show Prediction button—used later to display the model’s output—and the Interval Update control, which defines how frequently the visualization refreshes.
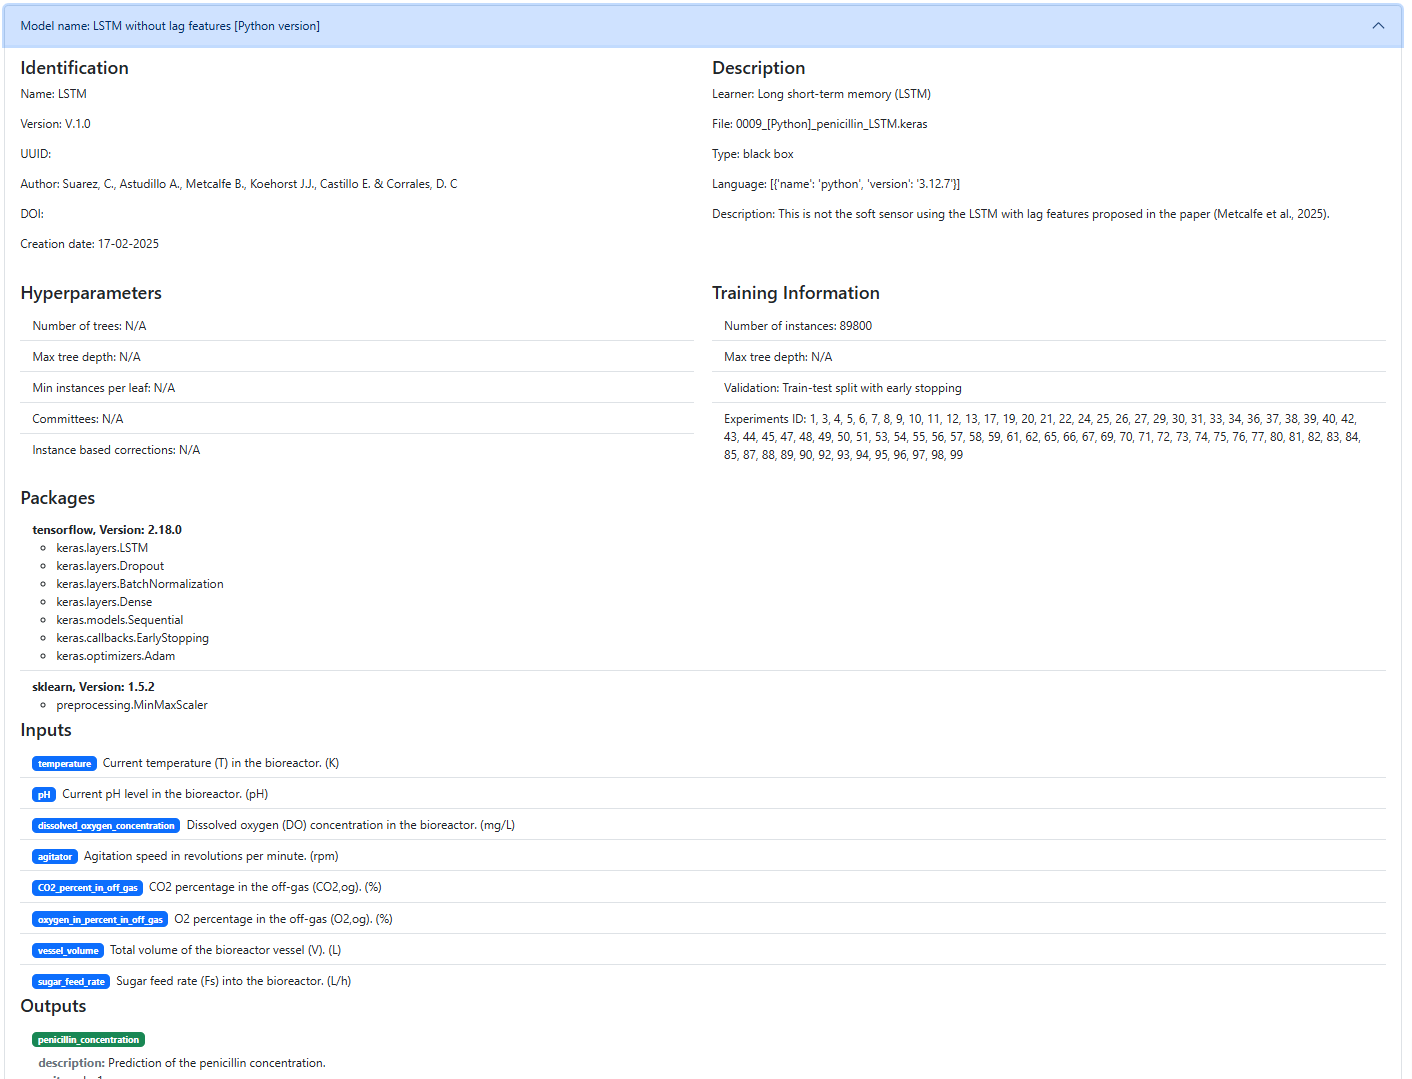
Once you select a Model Name, a collapsible details panel appears. This panel provides an in-depth overview of the selected model, including its identifier, hyperparameters, description, training information, required packages, input variables, and output structure.
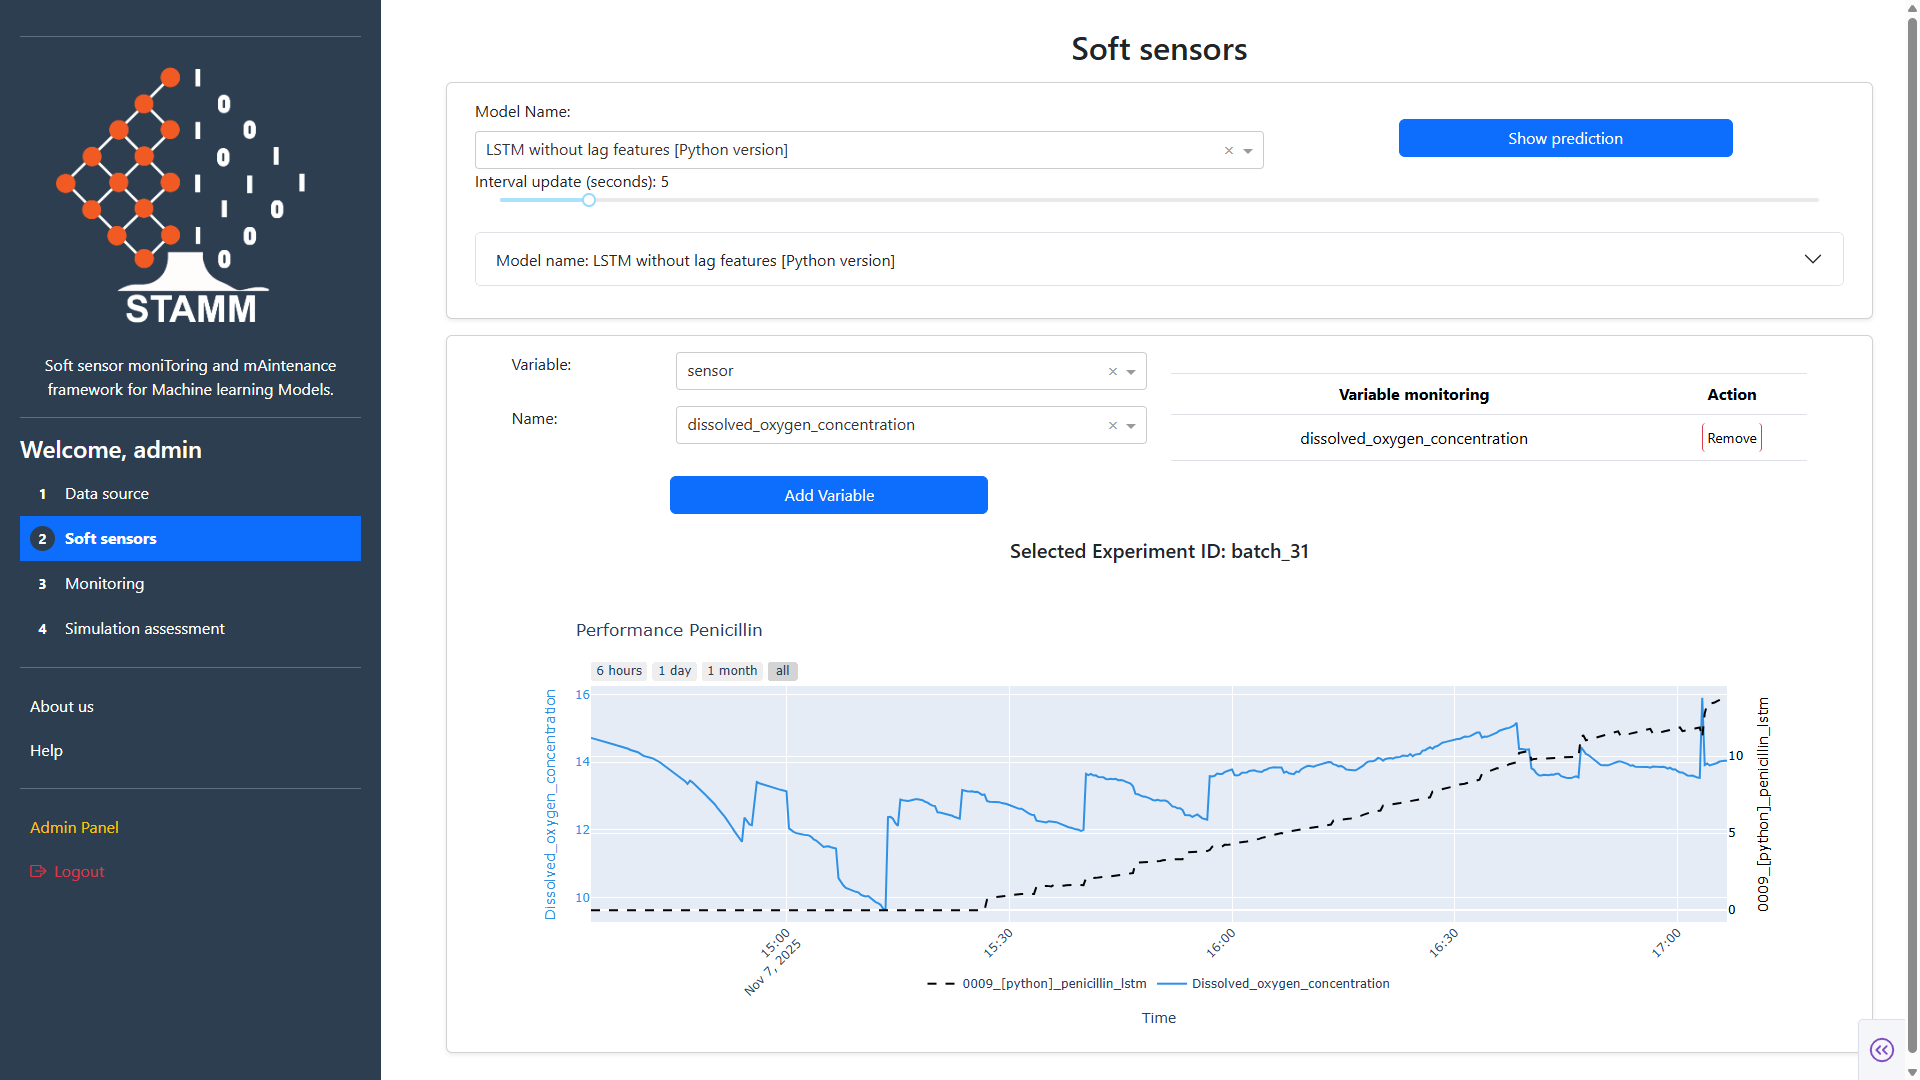
Visualize: After selecting a model, click Show Prediction to request the model’s predictions for the Experiment ID previously chosen in the Data Source section. The corresponding prediction plot will then appear, as shown in the image below.
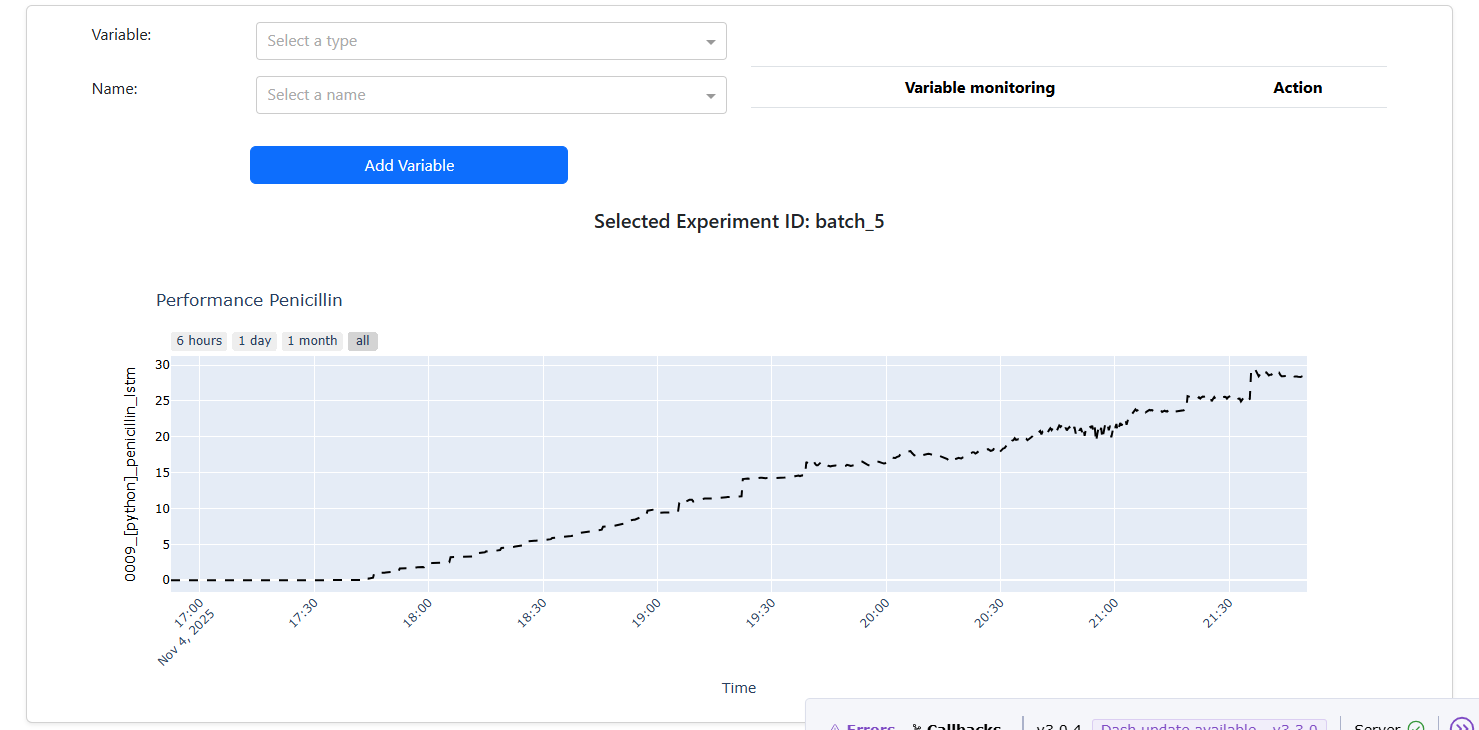
Additionally, the Variable and Name dropdown controls allow you to choose specific input variables from the selected model. These variables can be displayed alongside the model’s prediction, enabling you to monitor them together for comparison and analysis. The following example illustrates how this visualization is rendered.
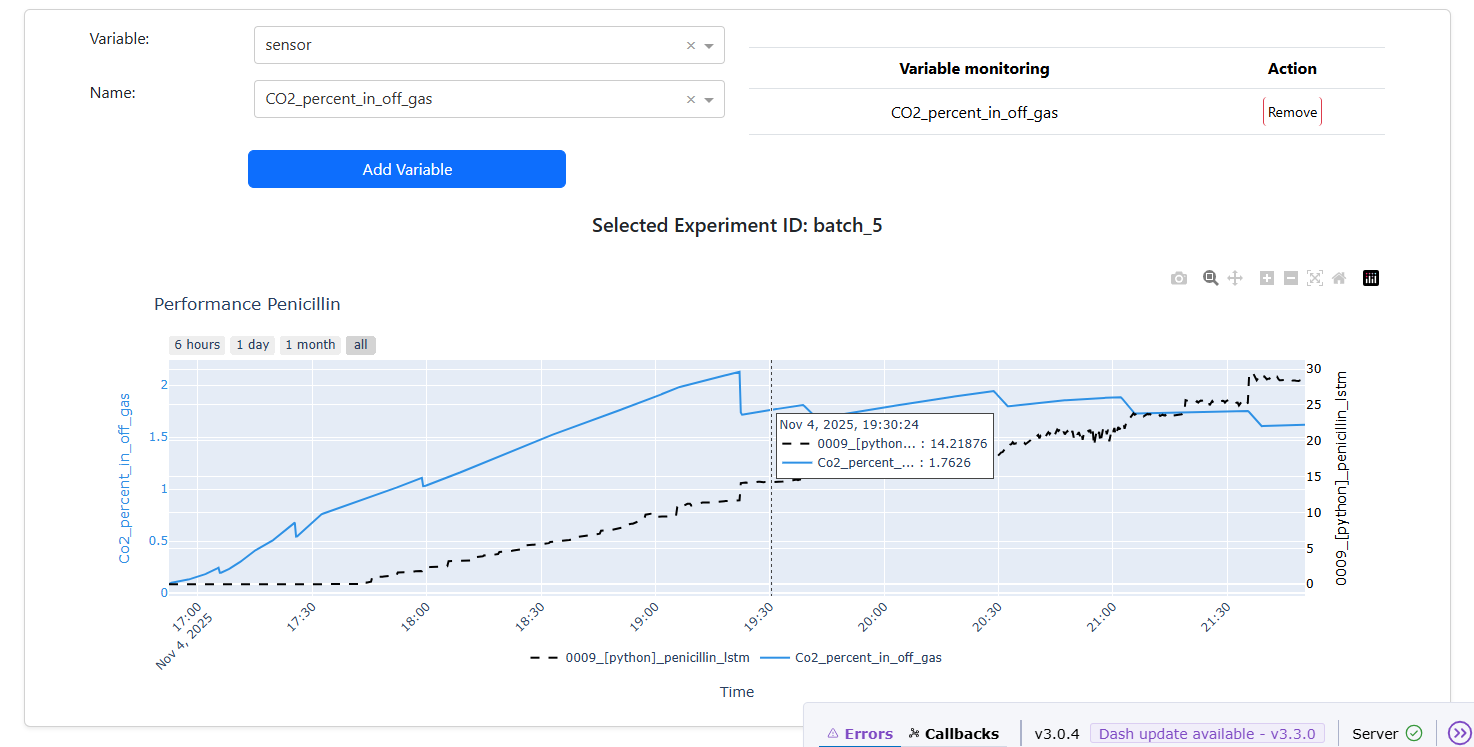
The chart also includes controls that let you adjust the displayed time range. You can choose to view data from the last 6 hours, the last day, the last month, or all available data, allowing you to explore trends at different time scales.
🎬 Video: Deploying and Visualizing Soft Sensors
A step-by-step guide on how to select, deploy, and visualize real-time simulations from soft sensors stored in the Model Registry, alongside live process data from sensors and actuators.
Version historical data:

Version online data: