Data Source
🗃️ Data Source
Pick an experiment, see its statistical fingerprint, check the most recent measurement, and inspect data availability over time. Everything you need to scope the data the rest of the dashboard will work on.
The four panels
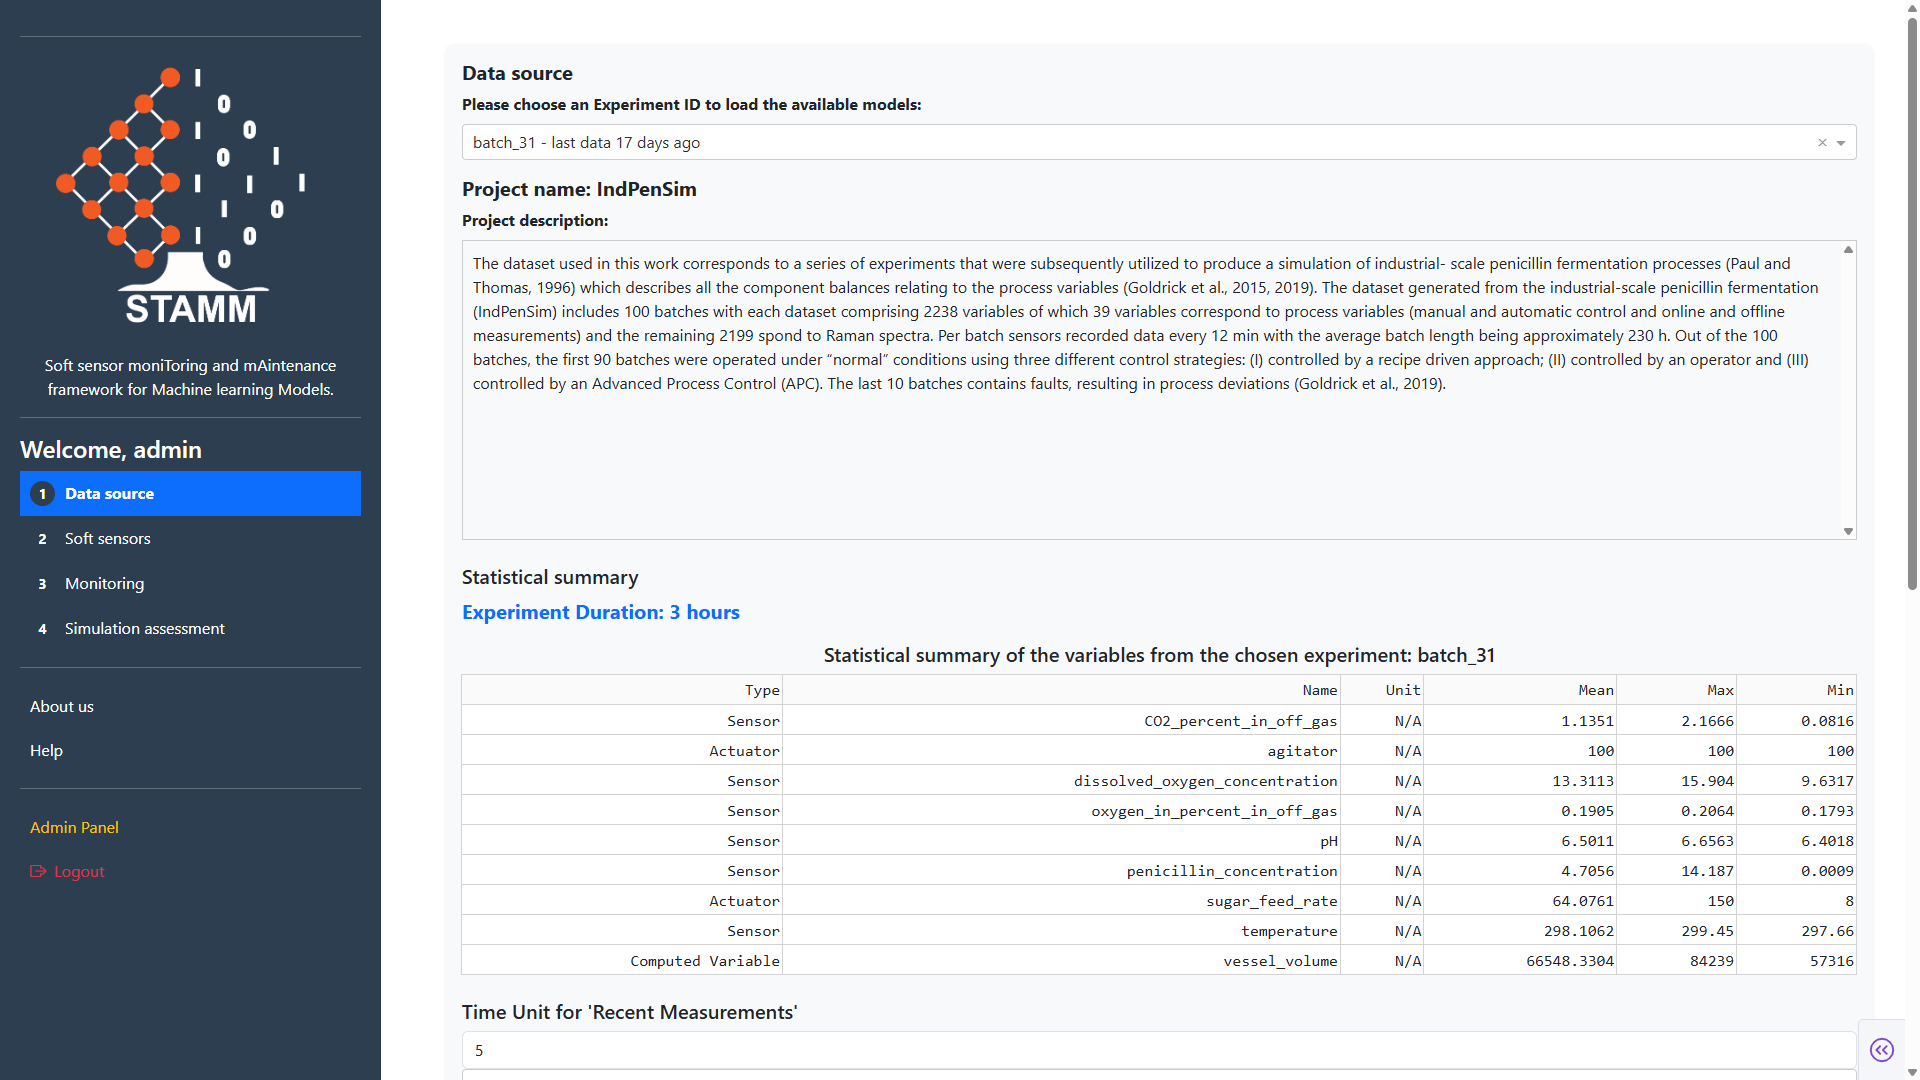
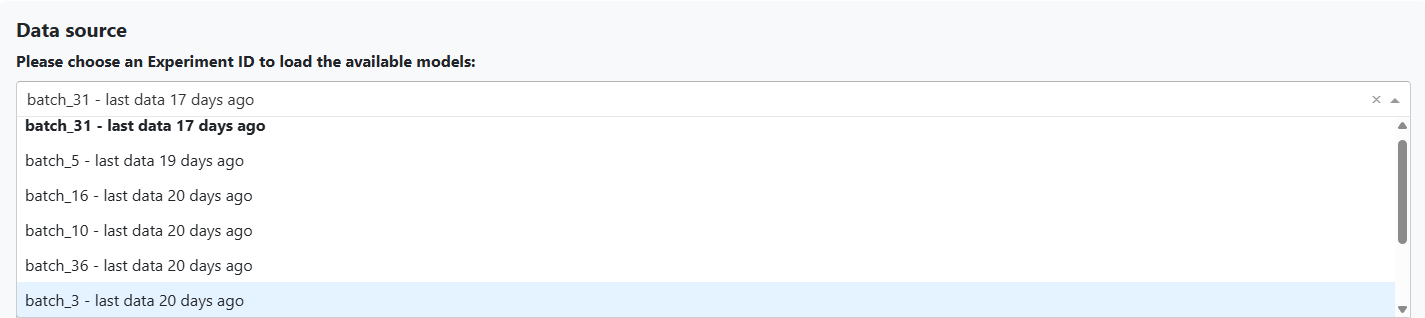
Experiment Selector
Pick the experiment that drives the rest of the dashboard. The dropdown also shows how long it's been since the last data point arrived — so you can judge recency before diving in.
- Single source of truth for the active experiment
- Predictions auto-load once an experiment is chosen
- Recency hint per experiment in the dropdown
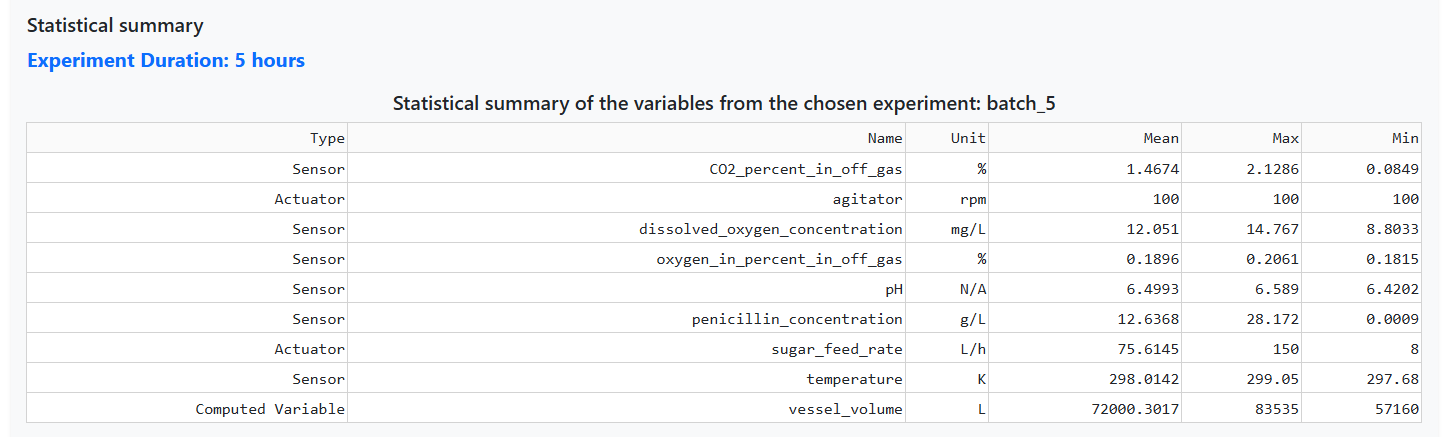
Statistical Summary
A clear, visual overview of every variable in the experiment — and the experiment's total duration. Each row carries the variable's type, name, unit, mean, max, and min.
- Type chips: Soft Sensor · Actuator · Sensor · Computed
- Engineering units and basic descriptive stats
- Total experiment duration at a glance
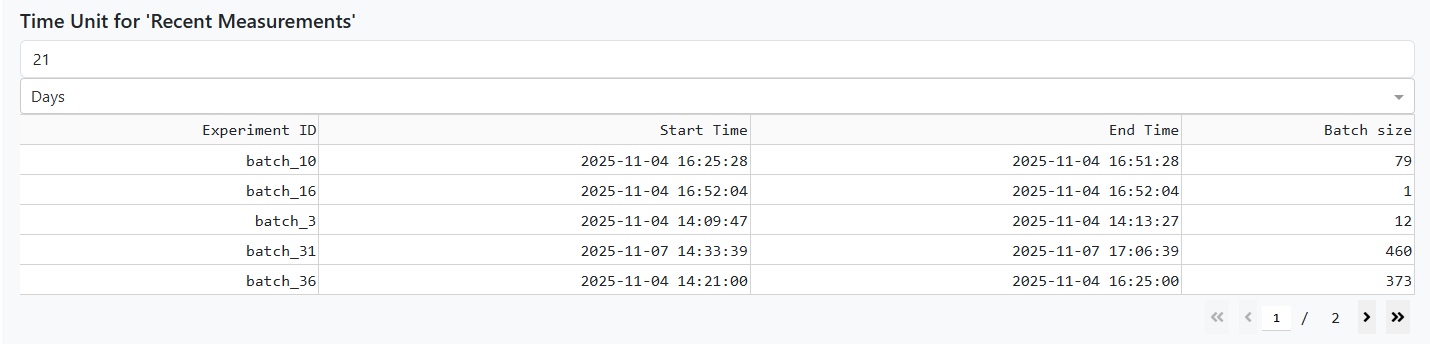
Last Measurement
See which experiments are still streaming. Pick a time window (minutes → months) and the dashboard lists every experiment that received data within it — start time, last value, and size.
- Pick value + unit (minutes, hours, days, months)
- Sortable table of recent experiments
- Experiment size = number of stored samples
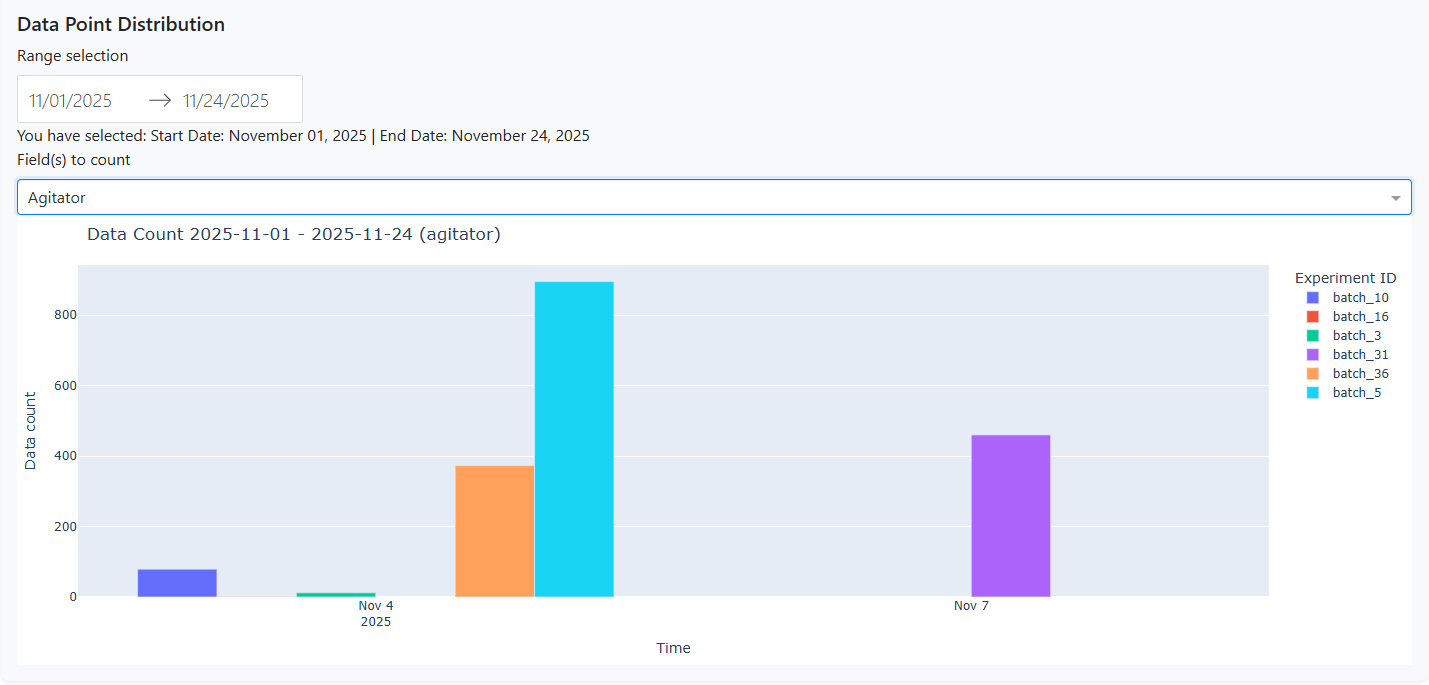
Valid Data Points Over Time
Audit data completeness. Pick a date range, choose variables (or all of them), and see how many valid points were recorded — handy for catching gaps before they bias an analysis.
- Custom date range
- Per-variable or whole-experiment view
- Spot gaps and inconsistencies early