Simulation Assessment
🧩 Simulation Assessment
Post-run analysis for a soft sensor: pick a model and a time window, inspect predictions against monitored variables, filter the data, flag anomalies, and export a multi-sheet report.
The workflow
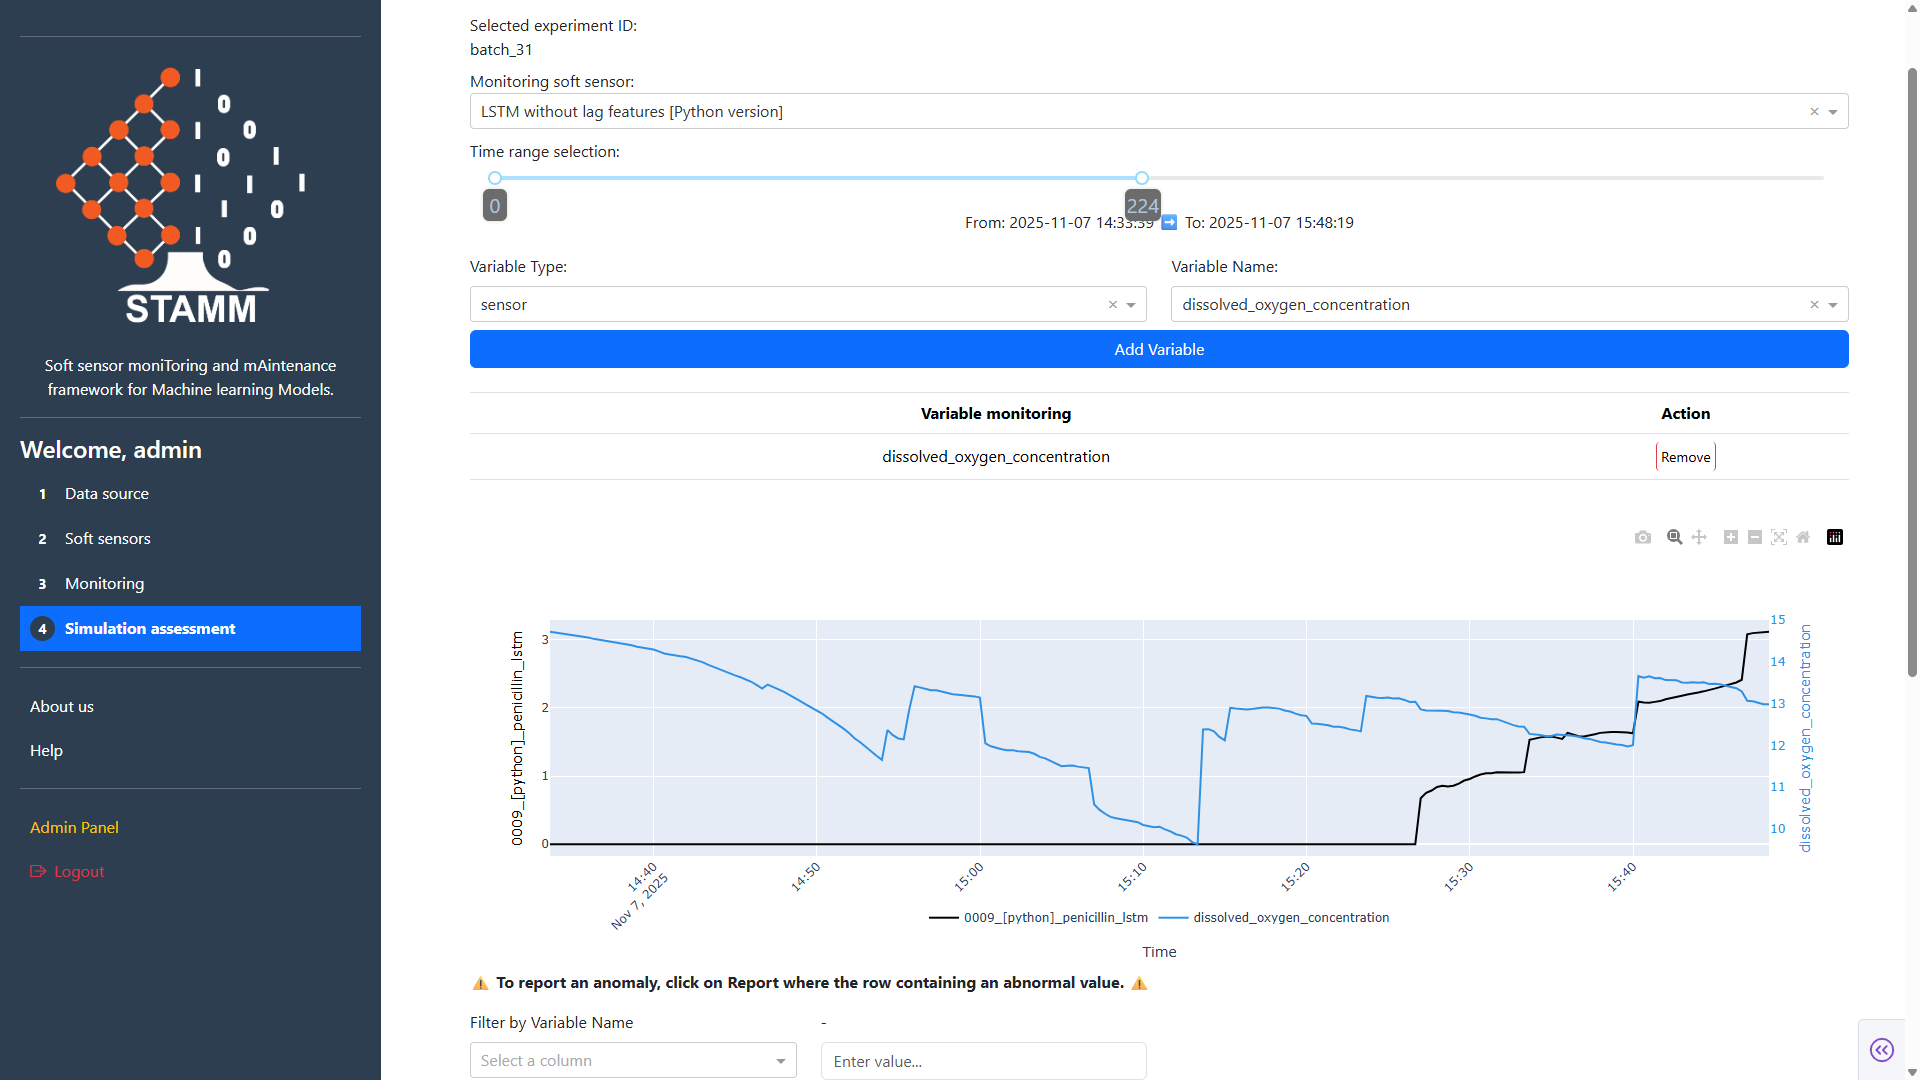
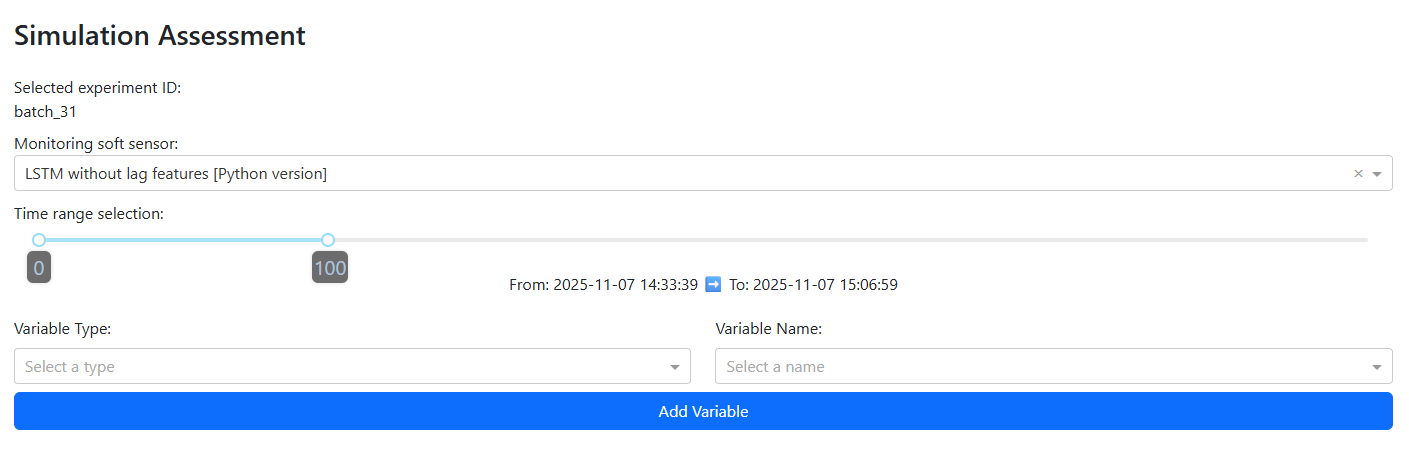
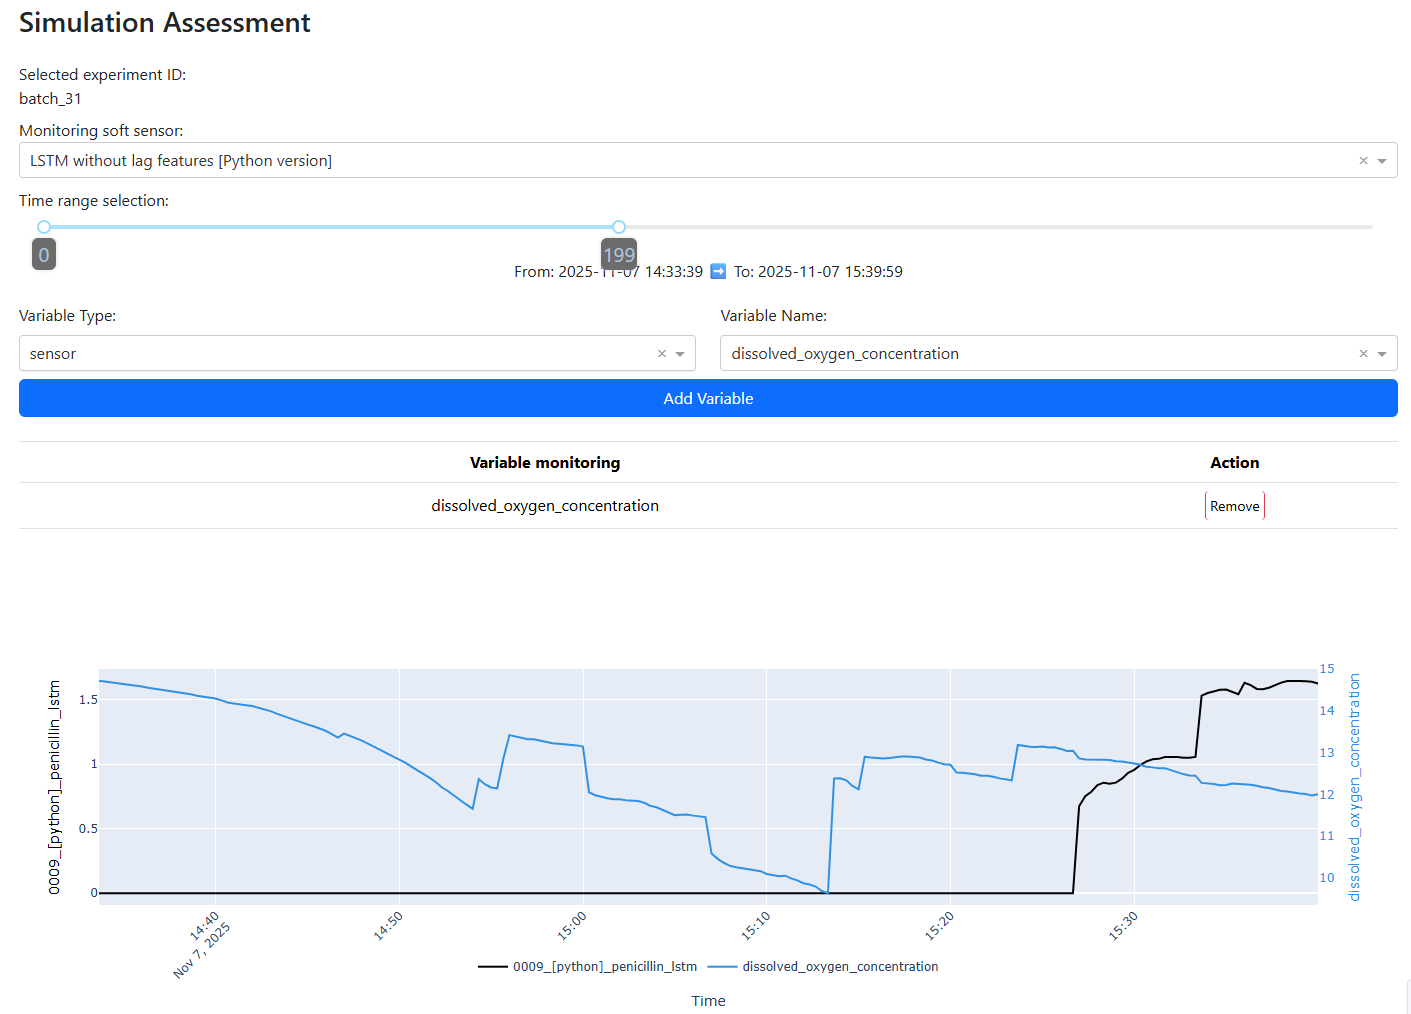
Initial panel — configure the run
A form opens with three controls. Pick the monitoring soft sensor from the Registry, define the time window for the experiment chosen in Data Source, and add any variables you want to track next to the prediction. Submit and the chart renders the prediction against the selected variables.
- Soft sensor dropdown sourced from the Registry
- Time-window slider scoped to the active experiment
- Multi-select for variables to overlay on the chart
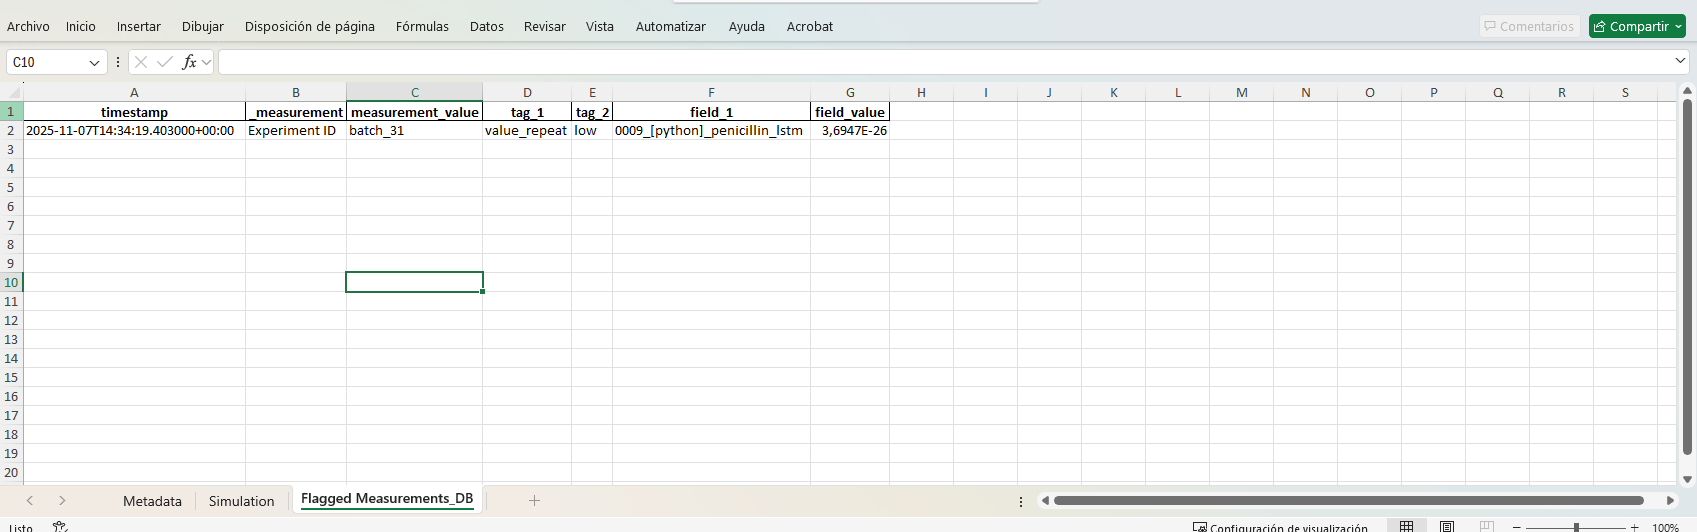
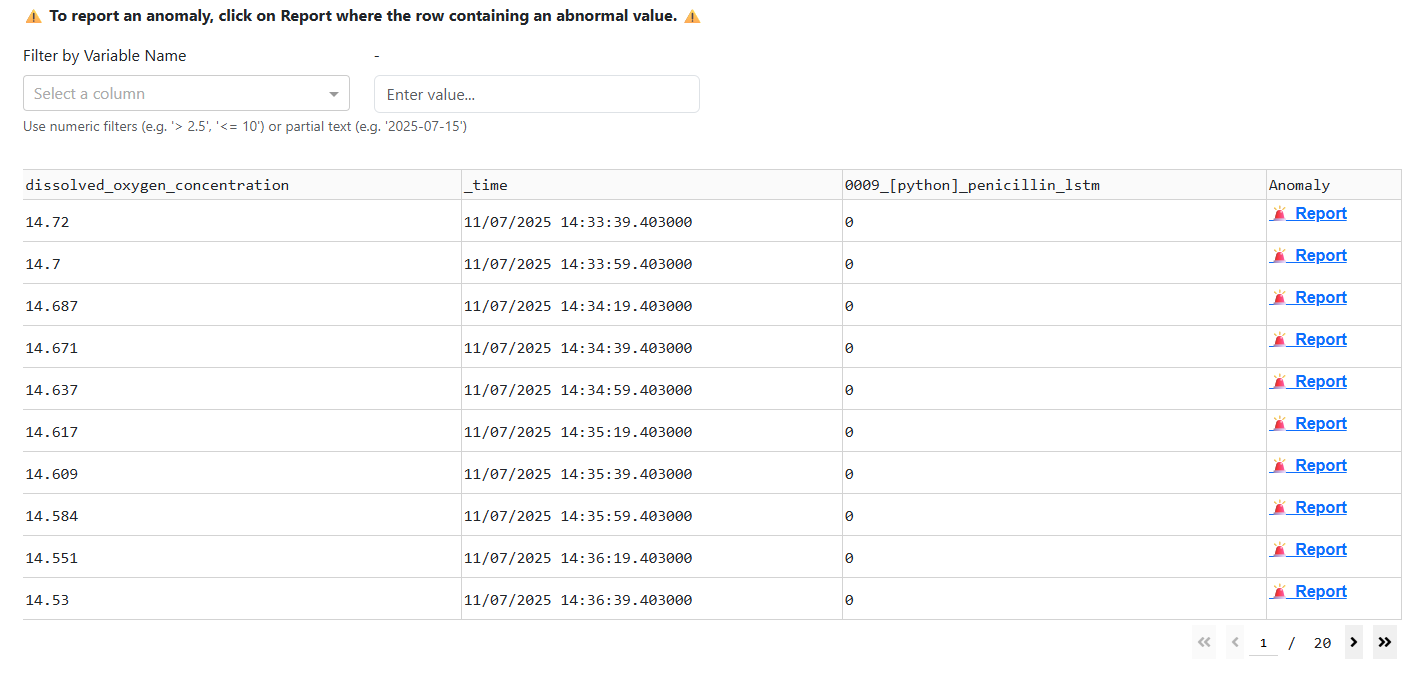
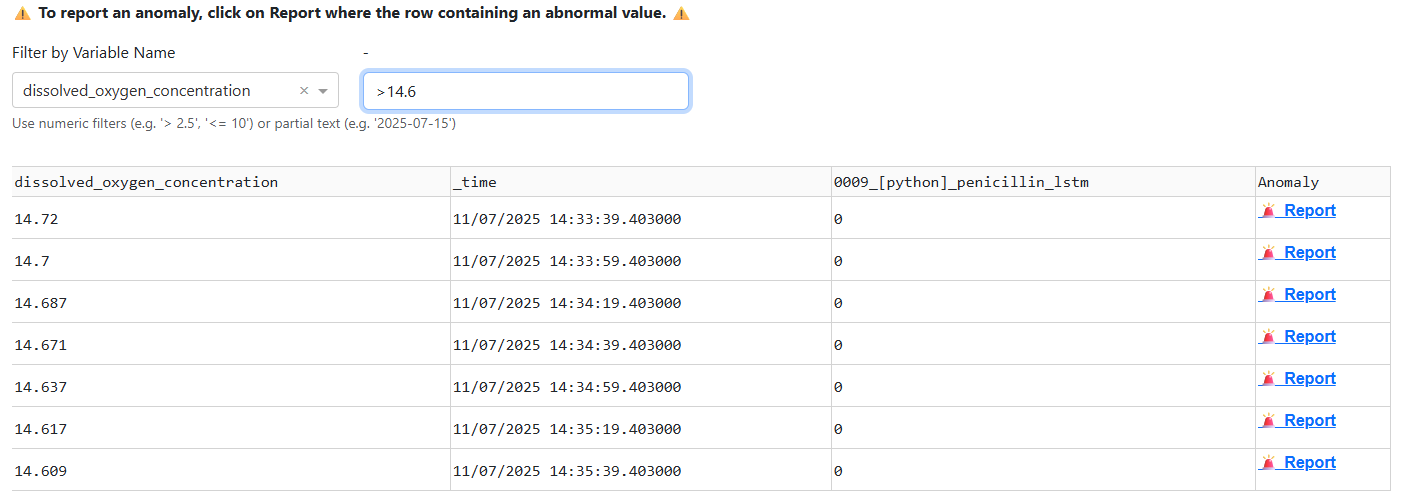
Data table — filter & flag anomalies
Below the chart, a table shows every row backing the plot: timestamps, monitored variables, and model predictions. Two tools sit on top of it — a value filter (operators >, <, >=, <=, plus partial text and date search), and an anomaly reporter that opens a popup form. After saving, a confirmation is shown.
- Filter by variable, timestamp, or predicted value
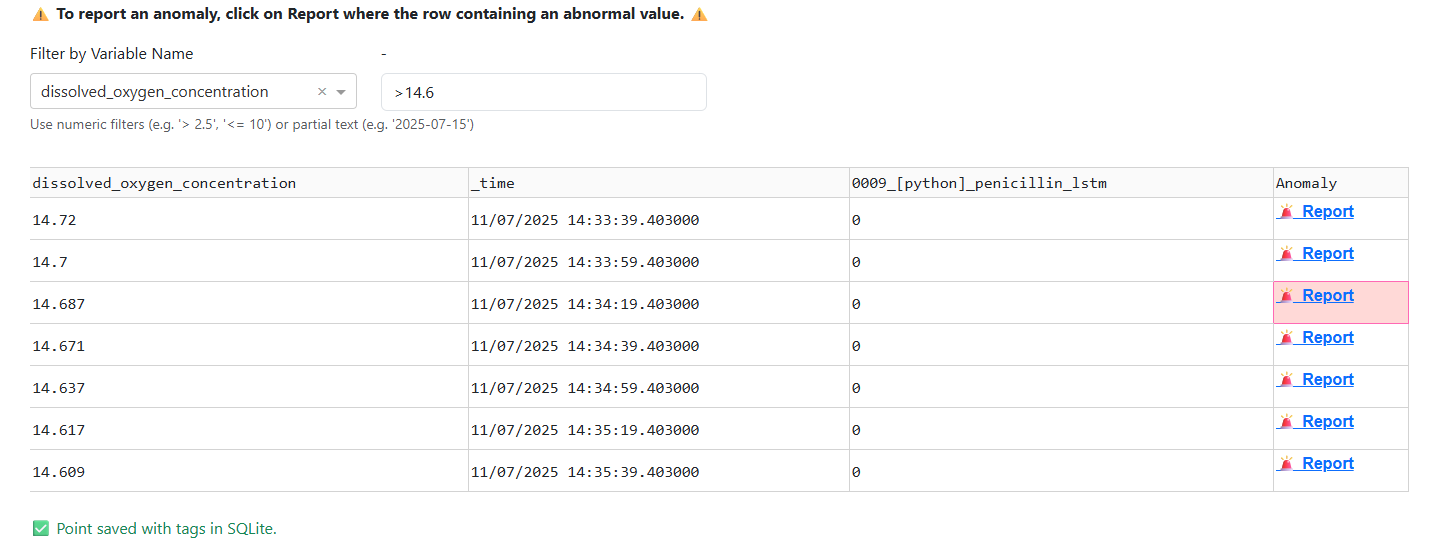
- Anomaly form captures the flagged entry + a note
- Confirmation toast after each save
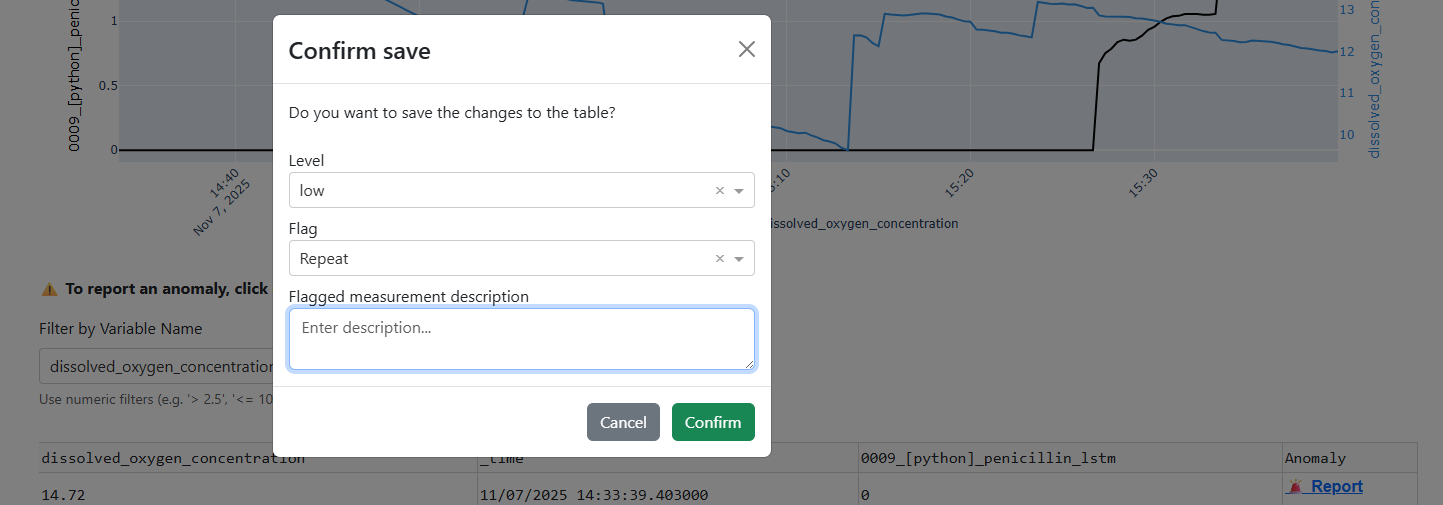
Anomaly form & confirmation
The anomaly reporter opens a popup form attached to the row you flagged. Submitting it stores the entry and shows a confirmation toast.
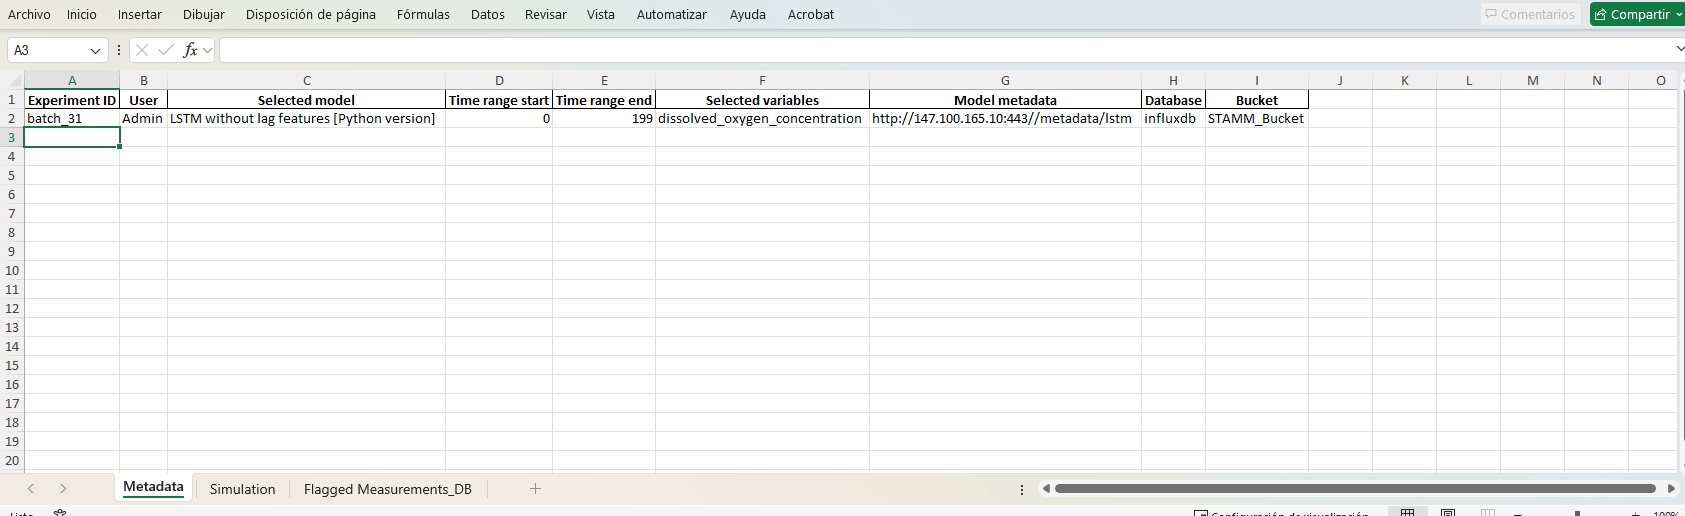
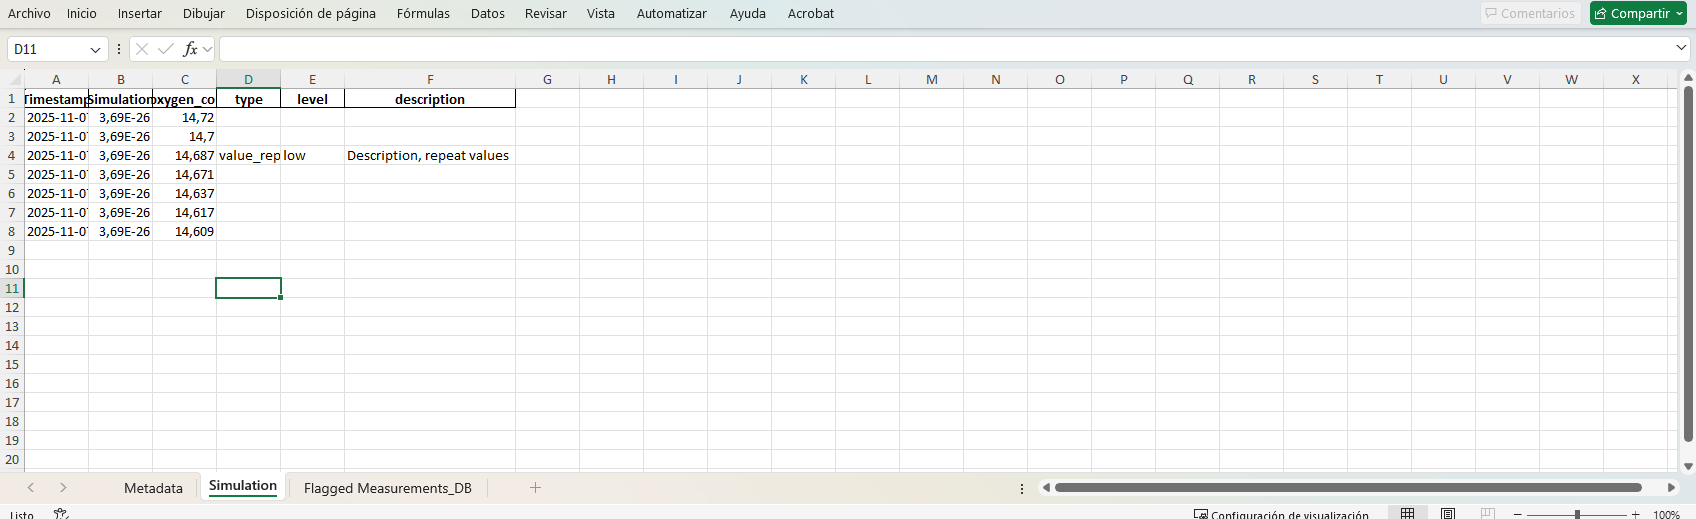
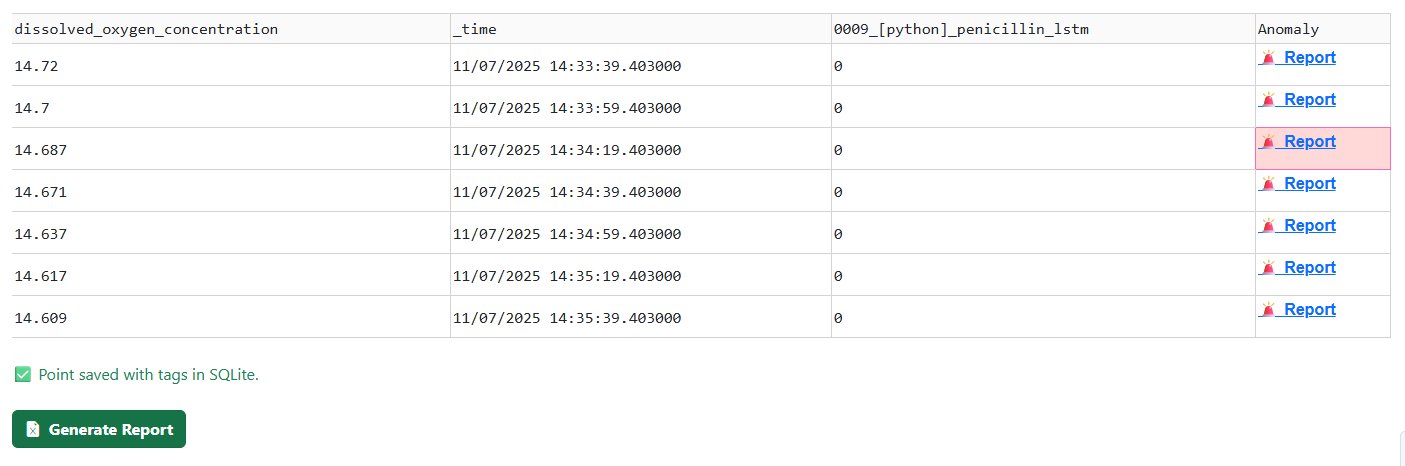
Reports — multi-sheet export
Once anomalies are recorded, STAMM produces a multi-sheet report that bundles the chart snapshot, the flagged entries, and metadata about the model and time window. A dedicated button inside the panel triggers the download.
- Chart snapshot + flagged entries + run metadata
- Multi-sheet workbook ready for stakeholders
- One-click download from the panel
What's inside the report
Three sheets covering the run — summary, flagged entries, and chart snapshot.