Soft Sensors
Dashboard · Section 2 of 4
🤖 Soft Sensors
Pick any soft sensor from the Model Registry, see its full configuration, and plot its predictions next to live process variables — in real time or over history.
How to use it
01
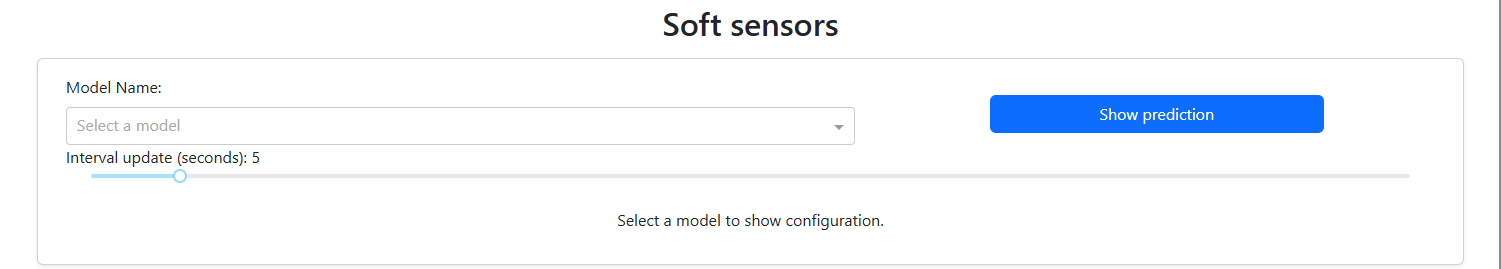
Pick a model
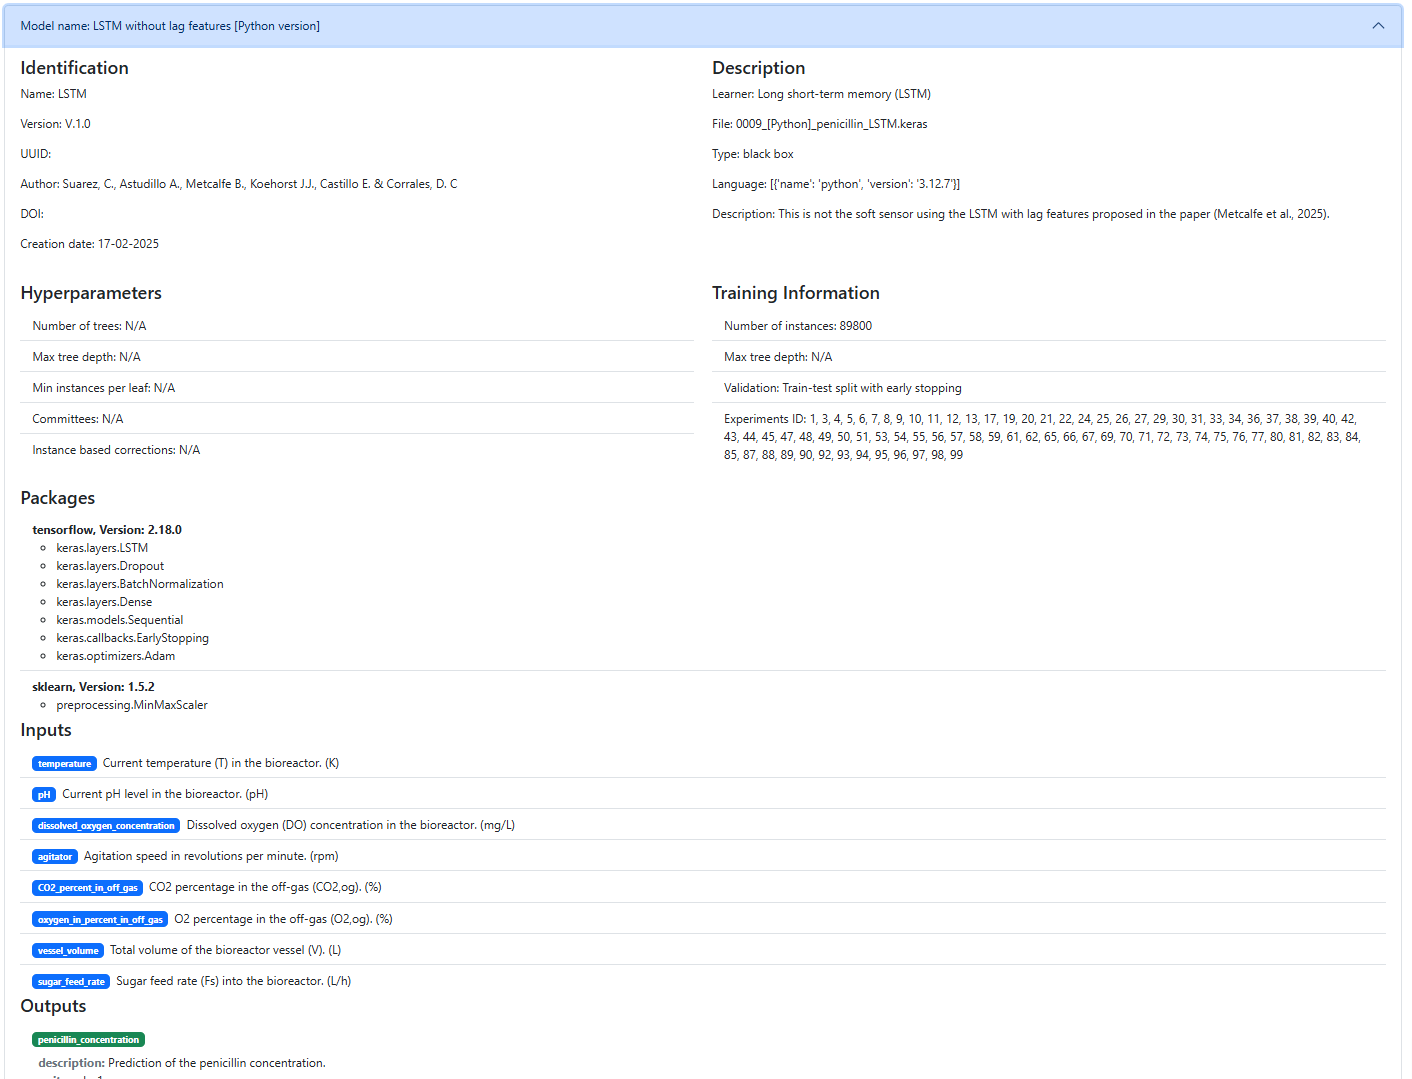
Open the Model Name dropdown — empty by default. Once you pick a model, a collapsible details panel slides open with the full registry record. Show Prediction triggers the plot; Interval Update controls how often it refreshes.
- Empty selector until a model is chosen
- Details: identifier · hyperparameters · description · training info · required packages · inputs/outputs
- Show Prediction + Interval Update controls live next to the dropdown
02
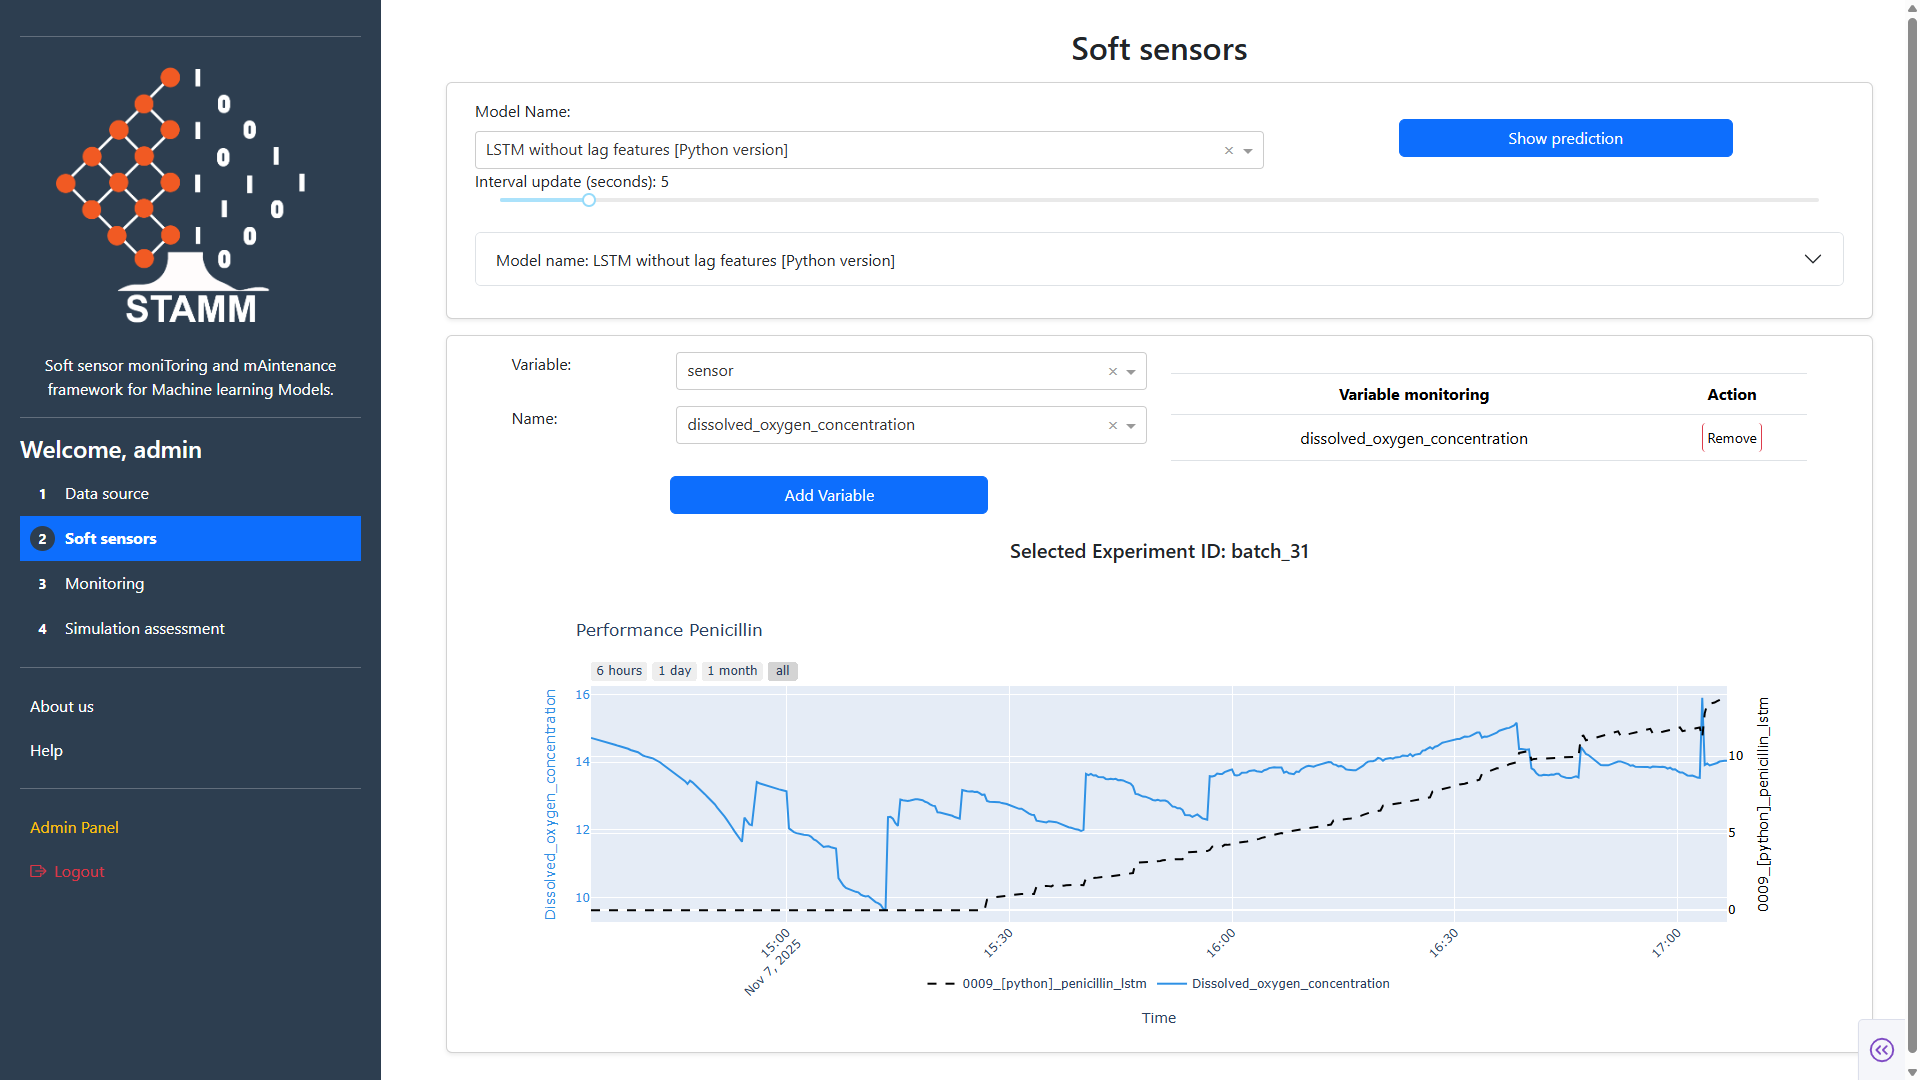
Visualize the predictions
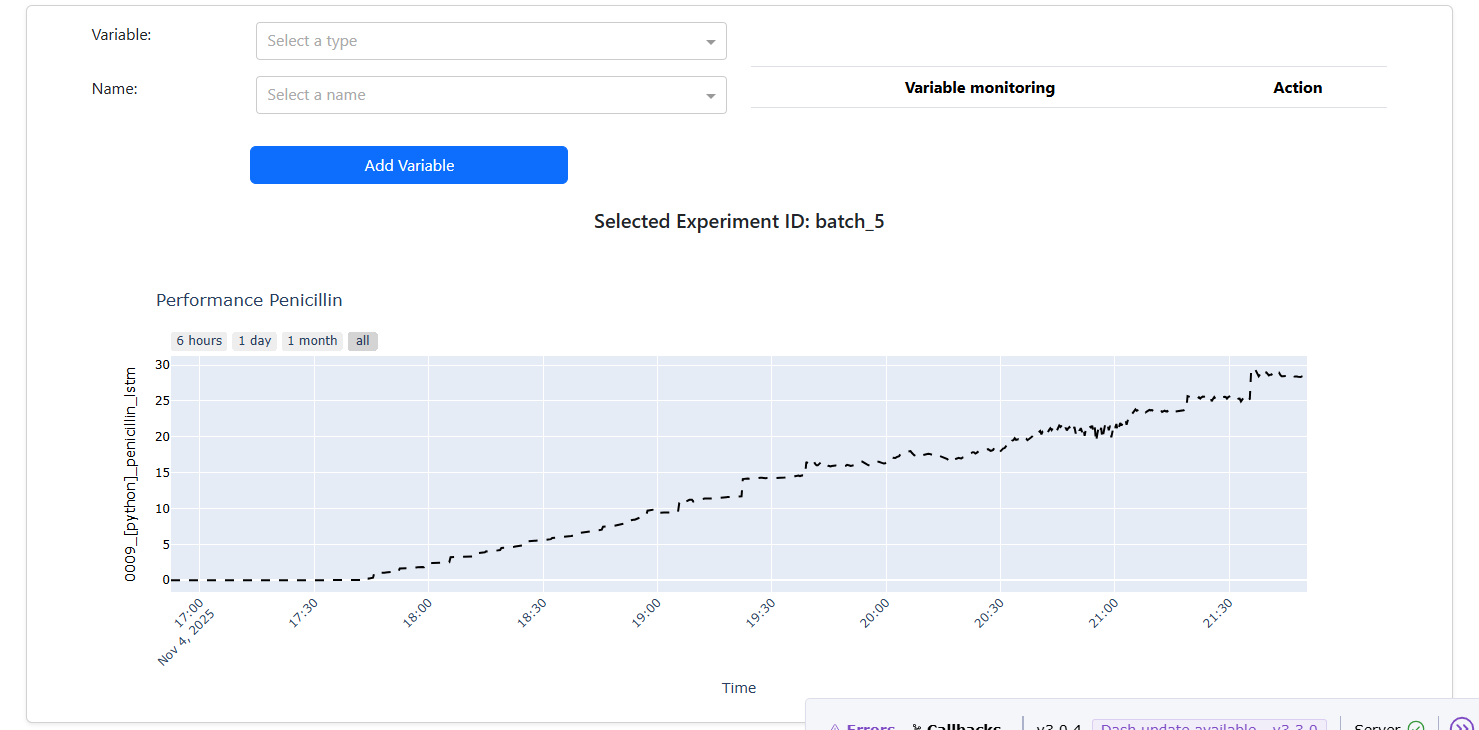
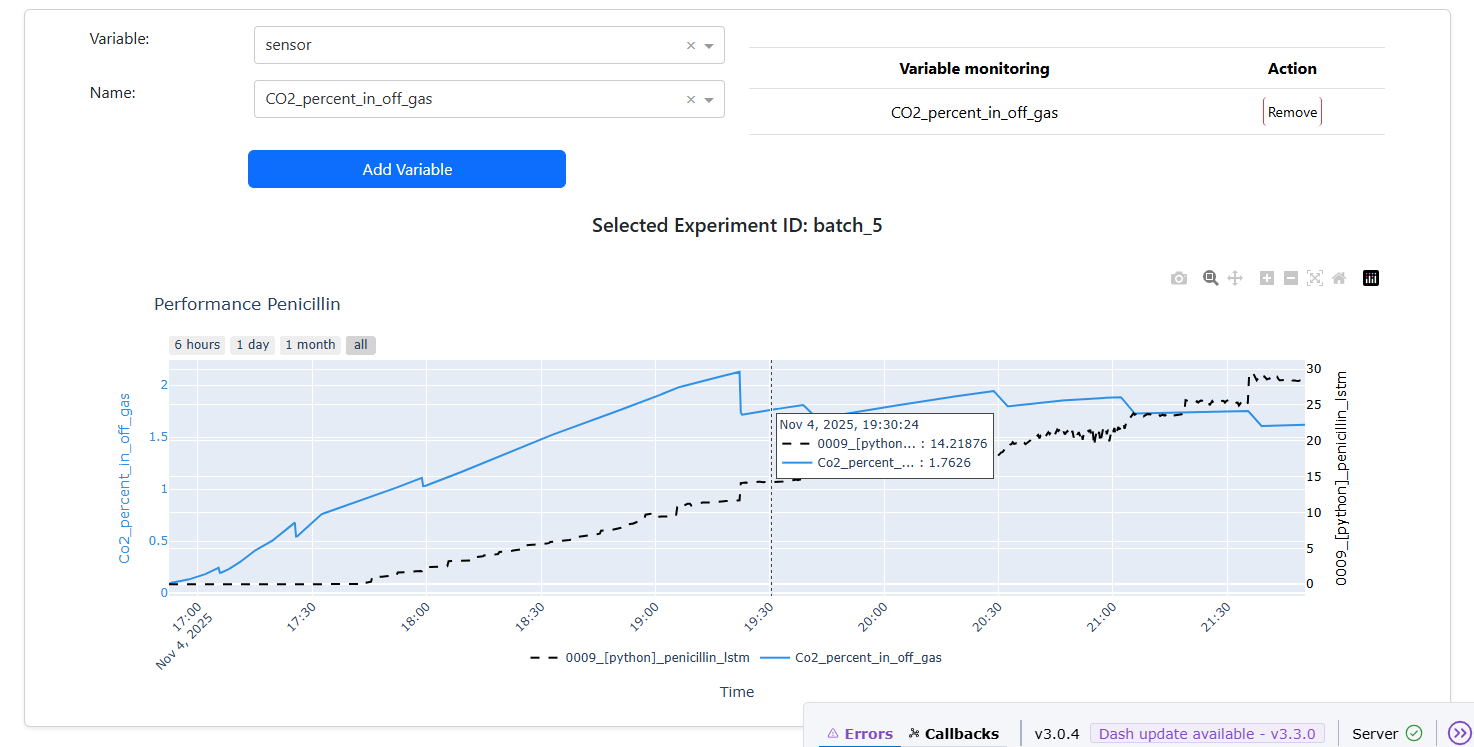
Hit Show Prediction and the chart appears for the Experiment ID picked in Data Source. Pile on input variables via the Variable / Name dropdowns to compare them against the model's output.
- Prediction trace on top of the selected experiment
- Add any input variable for side-by-side comparison
- Time-range buttons: last 6h · 1d · 1m · all
Video tutorials
🎬
Historical dataDeploy a soft sensor on a finished experiment.

📡
Online dataLive predictions next to streaming process data.